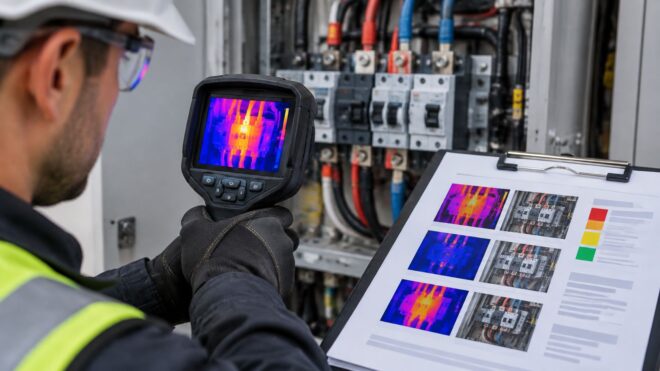
A thermal photo with a temperature stamped on it can sink a real fault or sentence a healthy panel to a needless repair. Both failures come from the same thin document: an image, a number, and nothing that lets a reader test whether the number means anything.
Load at the time of the scan, the comparison basis behind the measurement and a severity grade are what turn a picture into a finding. Strip those three away and a bright lug reads as "probably fine, we'll watch it," while a warm cabinet face in afternoon sun reads as an emergency.
The structure below comes from the standards that govern this work and from the arithmetic every credible finding has to survive. It's written for the people who sign the report and pay the repair invoice, not only for the person holding the camera.
Required Sections of an Infrared Inspection Report
Think of the document as nine compartments. Each one holds a different kind of information, and skipping one doesn't just shorten the report, it removes the ability of the next reader to check the work. The table is the minimum content for each compartment, not a full form.
| Report Section | What It Records | Minimum Content |
|---|---|---|
| Cover and scope | Client, site, inspector and scan details | Client name, address, inspector qualifications, scan date and time, equipment covered |
| Inspection conditions | Load, ambient and equipment state at scan time | Load percentage or phase currents, ambient temperature, wind and sun, energized status |
| Equipment inventory | Every asset scanned and every asset skipped | Asset ID, location, equipment type, rating, reason for any exclusion |
| Findings log | Each thermal anomaly with its measurements | Asset ID, phase or connection, maximum temperature, reference, delta T, emissivity assumption |
| Image pairs | Proof for each finding | Thermal image, matching visual photo, palette or scale shown |
| Severity summary | Grade for each finding | Severity grade, electrical risk, criticality of the served load |
| Recommendations | Corrective action for each finding | Action, responsible party, target timeframe, closeout status |
| Limitations and safety | What could not be verified | Camera limits, unreachable components, PPE and boundaries used |
| Appendix and baseline | Prior scans and change over time | Previous scan date, prior delta T, change since last report |
The standard behind this list treats the work as a documentation exercise as much as a measurement one. ASTM E1934-99a(2024) defines the examination as a process for identifying and documenting exceptions in electrical or mechanical systems, and it assigns documentation duties to both the end user and the thermographer (ASTM E1934). That split matters. The client brings the asset list and the operating context, and the thermographer brings the measurement and the image. A report with no client-supplied asset identifiers can't be closed out later.
What the front of the report has to settle
The cover and scope block answers who, where, when and what. It names the site, the person who did the scan, their certification level, the date and time the work started, and the equipment covered by the contract. Inspection conditions sit next in reading order because every number downstream depends on them: the load on each asset, the ambient temperature, wind and sun exposure, and whether the gear was energized.
The test of a scope block: a maintenance manager who joins the property three years from now should be able to work out exactly which panels were scanned without calling anyone.
The inventory is the section clients undervalue. It lists every asset scanned and every asset skipped, with a reason attached to each skip, whether that's a locked tenant space, a sealed section, or an arc-flash boundary that made the cover unsafe to open. A skipped panel with no explanation reads as an oversight, and an oversight in a report is a liability.
Why the findings log carries the weight
Each anomaly gets one entry, paired with a thermal image, a matching visual photo, and a visible palette or scale so the reader can see what temperature range the colors represent. Electrical work dominates this document type, which is why that log gets so much attention: electrical-system inspections represented 31.8% of the thermography building inspection market in 2024 (Reed Intelligence).
Every observation should be traceable to an asset identifier, location, equipment type, phase or connection, inspection date and time, both images, the measured maximum temperature, the reference temperature, the calculated difference between them, emissivity or reflected-temperature assumptions where relevant, the load condition, and a recommended action.
Some of the hardest cases to write are the ones where two different causes produce the same picture. A loose connection, phase imbalance, an overloaded conductor, poor contact and simple environmental heating can all look like heat, and they need different follow-up work.
The last three sections close the loop. Severity grades every finding. Recommendations assign an action, an owner and a timeframe. Limitations record camera limits, unreachable components, weather constraints and the boundaries and PPE used. The appendix then compares this scan to the previous one so a reader can see change instead of a snapshot. Three questions the appendix should always answer: what did this asset read last time, what does it read now, and is the movement in or out of a band that needs work. Draw those nine headings on a blank page and you have a working template.
Inspection Conditions That Change Every Temperature Reading
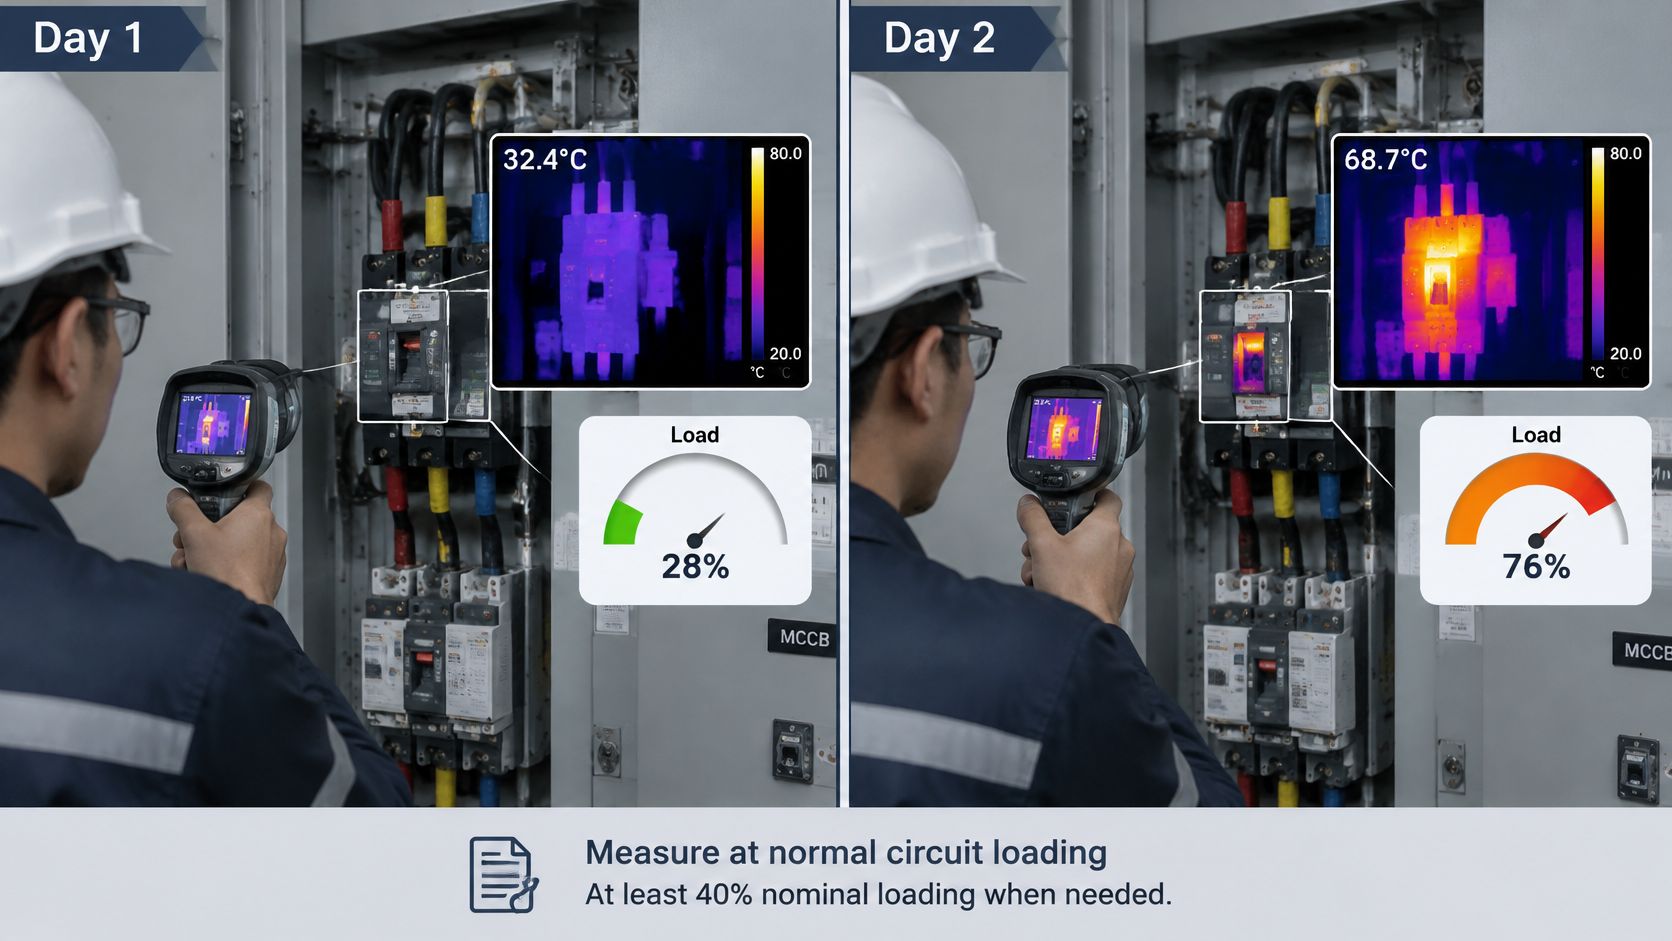
Two scans of the same panel, a week apart, can produce two different readings and neither is wrong. Load moves through the day. Ambient temperature climbs from morning to afternoon. Wind strips heat off an exposed enclosure. A hot spot is a relationship between current, resistance and surroundings, so the conditions that shaped the reading belong beside the reading.
Here is what a properly conditioned scan looks like in the file, and why the same lug can read cooler on a light-load day without anything being repaired.
The load rule and the floor beneath it
NFPA 70B guidance calls for infrared measurements at normal circuit loading. When normal loading isn't feasible, at least 40% of nominal circuit loading may be used, provided the reduced loading is documented in the report (NFPA 70B committee material). That word "documented" is the whole point. A scan at 40% load is a legitimate inspection. A scan at 40% load that doesn't say so is a guess wearing a temperature.
The same guidance requires temperature differences to be judged against comparable components under similar loading, or against ambient air where no comparable component exists, with the reference area and the difference written down. A finding with no stated reference can't be argued with, and a finding that can't be argued with can't be defended either.
Ambient, wind, sun and the surfaces that lie
Ambient air sets the baseline when there's no peer to compare against, so log it at the start and the end of the scan. Wind cools exposed bus and enclosure faces and can flatten a difference that would look serious in still air. Direct sun heats a cabinet door until it glows in the image, so note whether a face was in shade or sun at the moment of capture.
Surface finish changes readings too. Shiny metal and painted enclosures have very different emissivity, and a reflective cover can mirror a heat source from across the room. Record the assumption rather than pretending it wasn't made.
Opening gear without creating an incident
Accessible and necessary covers come off to get a clear line of sight, and opening energized equipment is governed by qualified-person procedures, electrical safe-work practices, arc-flash boundaries and local requirements. The report should state which covers came off and which stayed on for safety.
Practical rule: an anomaly never leaves the file without the load that produced it and the reference it was measured against.
Phase currents or load percentage, how long the equipment had been running, ambient, and equipment state belong beside every entry. A single temperature is never a pass or fail line on its own, because conductor size, connection design, enclosure ventilation, reflections and component ratings all shift what that number means.
How to Read Thermal Images Without Misreading Them
Three steps decide whether a hot pattern is a defect, and every one of them is a comparison rather than a measurement in isolation.
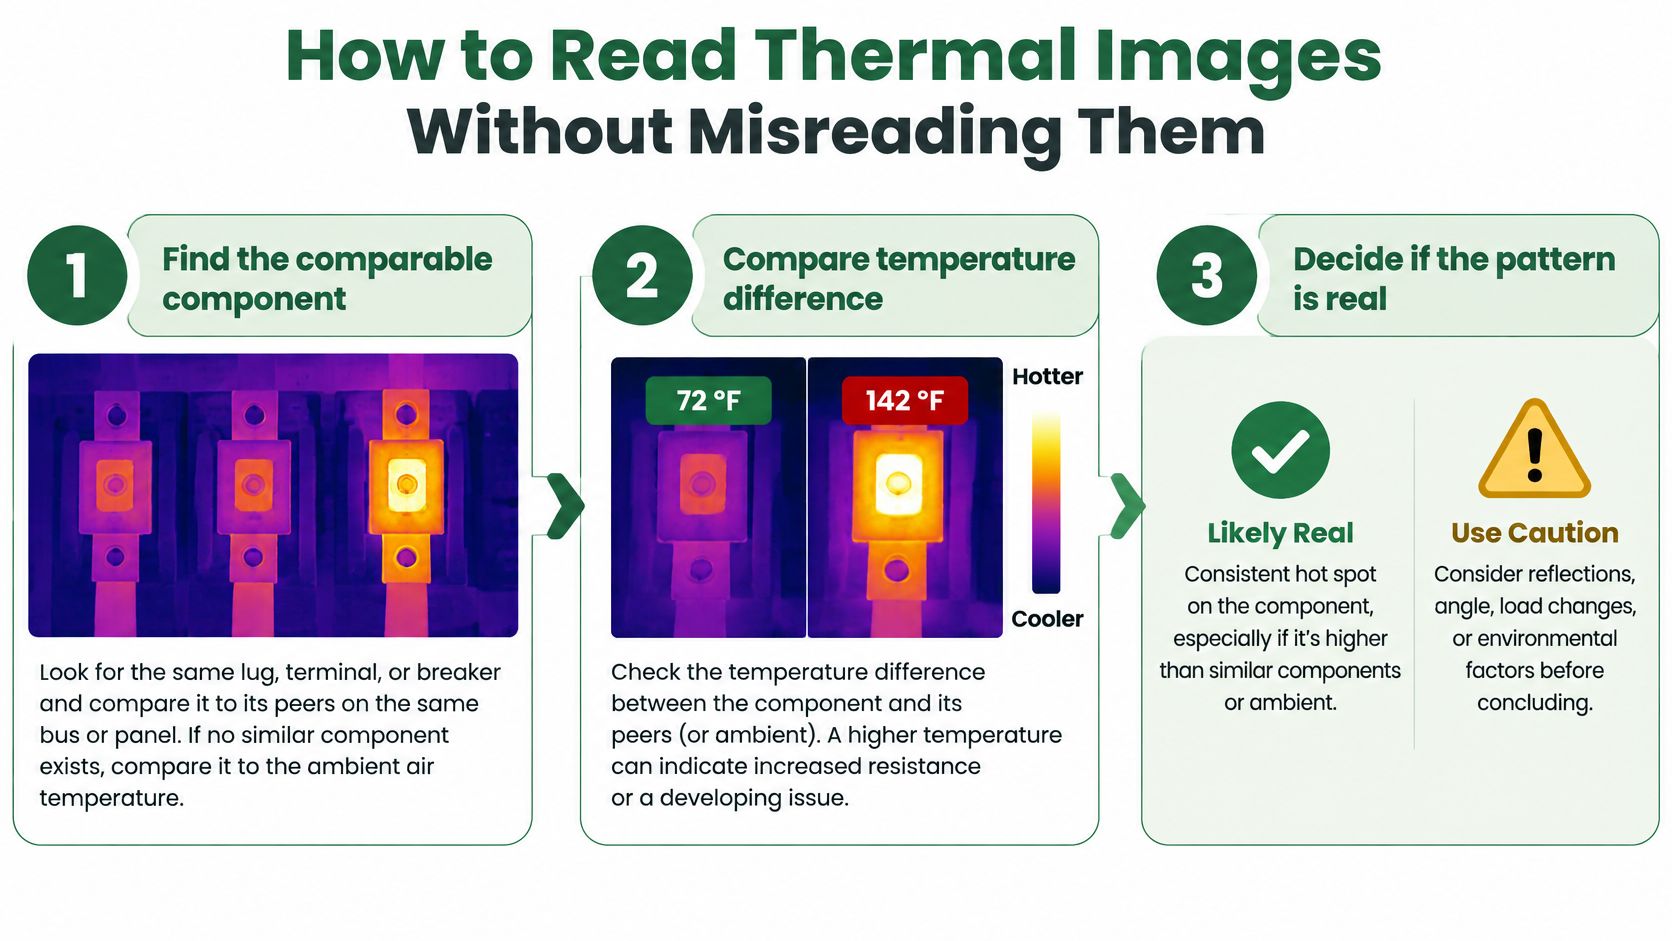
- Find the comparable component. Match the suspect lug, terminal or breaker against its peers on the same bus or panel. When there's no peer, use ambient air as the reference and say so.
- Measure the difference. Record the maximum temperature on the suspect part and the temperature of the reference, then subtract. That difference, not the peak number, is what the grade hangs on.
- Tie the difference to documented load. Compare the reading against the phase currents or load percentage already recorded for that asset. A difference at 20% load and the same difference at 80% load don't carry equal weight.
The method has been refined for a long time. Infrared thermography has been used commercially for electrical inspections since the early 1960s, which gives it more than six decades of field history as a nondestructive method that needs no contact and no shutdown (QIRT historical paper). Those decades also exposed the method's weak point: surveys may run at loads as low as 10% of design load for maintenance work and 40% for acceptance testing, and findings shift substantially as load changes.
Reading the pattern once the numbers exist
A single hot point at one lug, terminal or splice, sharply different from its peers, points to a loose or high-resistance connection. Retorquing and a re-scan confirm it.
One phase running hotter than the other two on the same circuit suggests imbalance or an overloaded conductor. Check phase currents before choosing between those two causes, because they need different fixes.
A whole enclosure that runs warm and even, with no single point standing out, usually reflects ambient or ventilation conditions. Confirm that by checking the ambient reference and looking at the vents.
A bright spot that moves when the camera moves is a reflection. Confirm it from a second angle. A sun-facing cabinet face that reads warm is solar loading, which you confirm by scanning the shaded side or coming back at a different hour.
Breaker bodies sit in the middle of this. Heat on the body itself can mean internal contact wear or overload, and the tie-breaker is the load compared with the device rating.
Automated recognition is improving but hasn't removed the human step. A 2024 study in Scientific Reports evaluated 143 infrared fault images of complex electrical equipment and reported recognition accuracies of 87.23%, 86.54% and 90.91% for three equipment categories (Scientific Reports). The remainder of that share is why a person still signs the page.
A pattern becomes a confirmed defect in one of two ways: a repeat scan at comparable load, or a physical inspection by a qualified person. Until one of those happens, the report calls it an apparent pattern, and that label is a promise that nobody guessed.
Sample Findings Recorded in a Working Report
A blank template is easier to judge against a filled one. Below are five entries from a commercial scan, written the way a maintenance team can act on them without a floor plan open on the desk.
| Asset and Phase | Tmax (°C) | Reference (°C) | Delta T (°C) | Severity | Recommended Action |
|---|---|---|---|---|---|
| Panel MDP-2, main breaker B14, phase B | 99 | 62 | 37 | Critical | De-energize or reduce load; emergency repair; re-scan before re-energizing at full load |
| Disconnect DS-3, line-side lug, phase A | 62 | 44 | 18 | Urgent | Retorque or replace lug; re-scan within 30 days |
| Panel LP-1, branch breaker 7 | 51 | 42 | 9 | Investigate | Repair in next outage window; re-scan at next cycle |
| Transformer T-1, bushing C | 55 | 53 | 2 | Monitor | Log; re-scan at next scheduled interval |
| Rooftop disconnect, cover reflection | 51 | 40 | 11 | Not confirmed | Re-image from second angle before grading |
Read the first row and notice what does the work. The 37°C difference on a main breaker, with visible discoloration at the connection, is not a scheduling item. It's a load reduction and an emergency repair, and the action column says so in words a property manager can forward to an electrician at 9 p.m.
The DS-3 lug at 18°C above its reference is one step down. The reference of 44°C follows from its 62°C maximum and the 18°C difference, and that arithmetic is the difference between an urgent finding and an anecdote. Retorque or replace the lug, then re-scan within 30 days.
Branch breaker 7 at 9°C goes to the next outage window. Nothing about the building changes tonight, but the entry records a baseline that makes next year's 14°C meaningful.
Why the smallest number still earns a row
A transformer bushing at 2°C above reference looks like filler until you see the history behind it. Monitor-only findings cost nothing to log and they're the only way a slow drift becomes visible before it becomes a failure.
The last row is the one worth studying. A rooftop disconnect appeared to run 11°C warm against a 40°C reference, and the pattern turned out to be a reflection off the cover. It's recorded anyway, marked not confirmed, with an action to re-image from a second angle. Leaving it out would be worse than including it, because the next thermographer would find the same artifact and start the investigation from zero.
Run your eye down six columns for every line in your own file: asset and phase, maximum temperature, reference, difference, grade, action. A blank in any of them isn't a formatting issue. It's the gap where a real fault gets dismissed or a harmless artifact gets a work order.
Severity Grading for Thermal Findings
A grade is a decision, and decisions need bands. The bands below come from widely used guidance for comparing similar components under similar load, and a client's own written standard overrides them whenever it sets something stricter.
| Grade | Delta T (°C) | Priority Action | Re-scan Timing |
|---|---|---|---|
| Monitor | 1-3 | Log in report; re-image at next scheduled scan | Next scheduled scan |
| Investigate | 4-15 | Verify with load check; schedule repair in next maintenance window | Next scheduled scan or after repair |
| Urgent | 16-30 | Repair promptly; reduce load on the circuit where feasible | After repair, under comparable load |
| Critical | Above 30, or visible damage or arcing | De-energize or reduce load; emergency repair | Before re-energizing at full load |
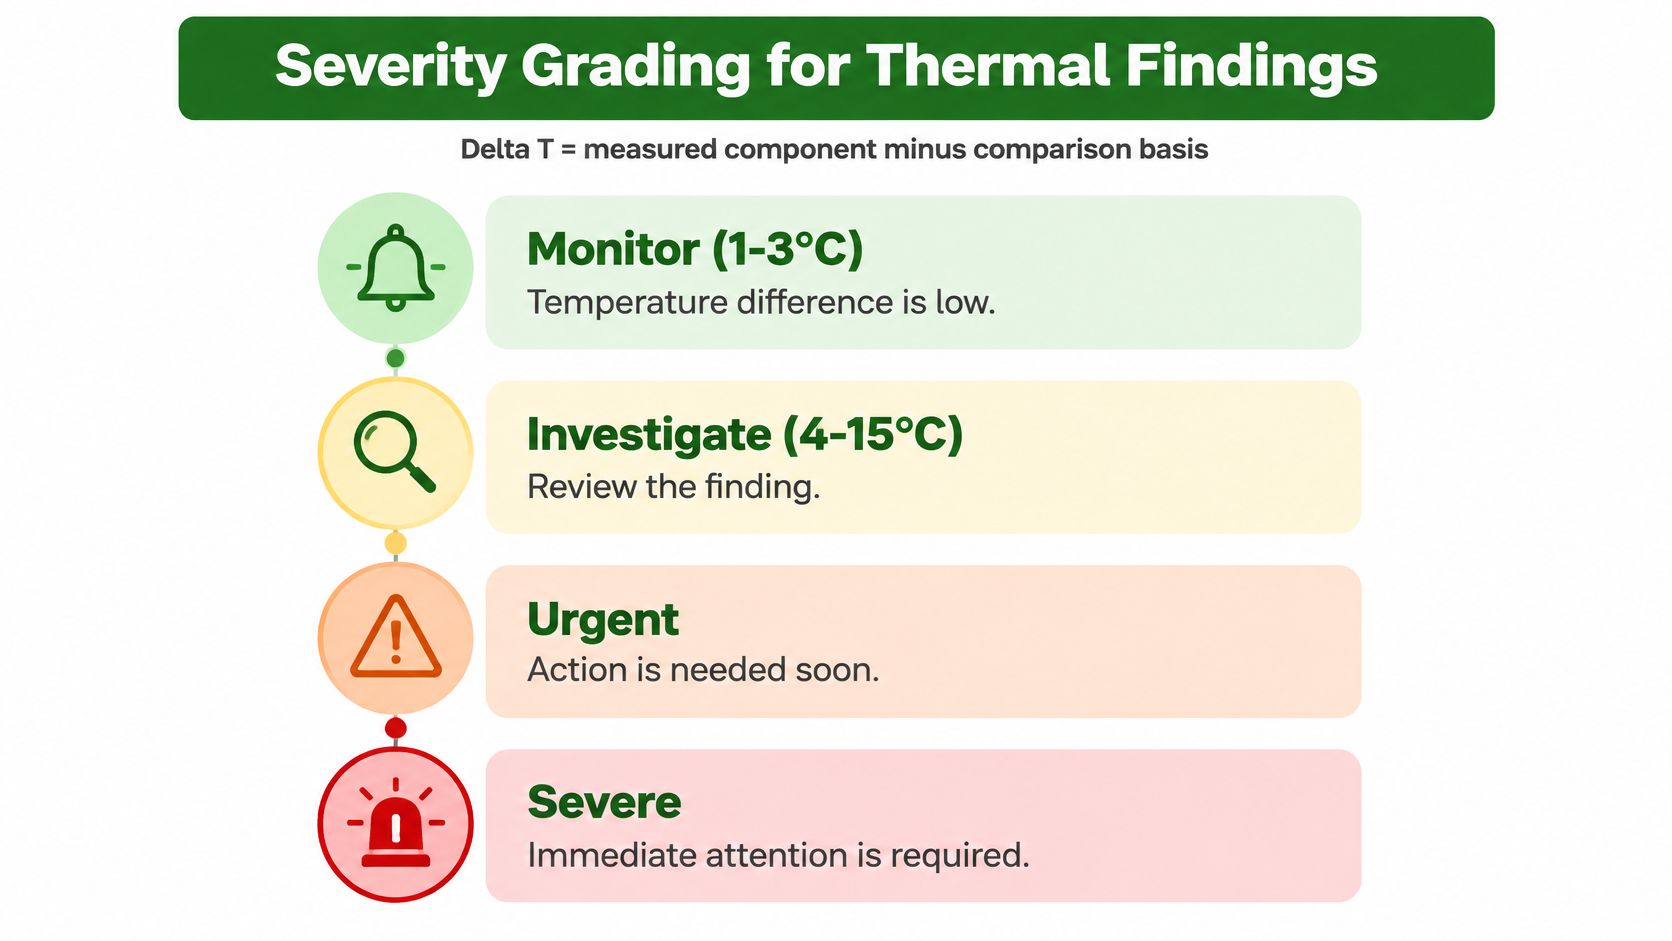
Some templates label the top band severe instead of critical. The label matters less than what it triggers, which is removing load from the circuit rather than planning around it.
Three inputs, one grade
The difference alone doesn't set the grade. Three inputs sit behind it: thermal severity, electrical risk, and the criticality of the load being served.
A hot connection on a service disconnect carries more electrical risk than the same difference on a spare breaker. A 12°C difference on a panel feeding emergency lighting or a fire pump is graded urgent, even though 12°C starts inside the investigate band, because the served load changes the consequence of failure.
Trend belongs in that trio as well. A finding that has climbed 5°C since the last report can deserve a higher grade than its current number suggests, because the direction of travel is telling you something the snapshot can't.
A grade is a claim about consequence, not a claim about temperature.
Where the grade goes in the file
Grades appear twice. Once beside each finding in the log, so a technician reading a single line knows the urgency, and once in the severity summary at the front, so a property manager can see at a glance whether this year's scan produced two critical items or two monitor items.
The summary is also the honest place to show what changed. Critical and urgent counts going up across two cycles is a maintenance story, and it's the story a capital budget conversation needs.
Corrective Actions by Root Cause
Repair work on energized gear belongs to qualified electricians working under lockout and the property's safety procedures. Every action should record the material, torque value or rating used, because the next report will be judged against it.
| Root Cause | Corrective Action | Verification |
|---|---|---|
| Loose or under-torqued connection | Clean contact surfaces; retorque to manufacturer value | Re-scan under comparable load; delta T drops to a lower band |
| Corroded or oxidized lug | Clean or replace lug and connector; apply compatible anti-oxidant where specified | Re-scan shows reduced delta T at the same load |
| Overloaded conductor or breaker | Reduce load, or upsize conductor and device to design rating | Phase current measured after change; re-scan at documented load |
| Phase imbalance | Redistribute loads across phases | Compare phase currents and temperatures after rebalancing |
| Worn or failing breaker or switch | Replace with a correctly rated unit | Re-scan at load; no recurring heat at the device |
| Poor enclosure ventilation | Clear vents, add airflow or relocate equipment | Re-scan shows lower enclosure temperature against the ambient reference |
| Reflection or solar artifact | No repair; record as not confirmed | Clean image from a second angle attached to the report |
The rows sort themselves into three workloads. Mechanical fixes are the quickest: a loose connection gets cleaned and retorqued to the manufacturer's value, a corroded lug gets replaced with a compatible connector, and the anti-oxidant goes on where the connector specification calls for it. None of that requires a design change, and all of it fails if the torque value isn't recorded.
Load-side fixes take longer. An overloaded conductor or breaker gets relief by moving load, rebalancing circuits, or upsizing the conductor and device to the design rating. Phase imbalance gets corrected by redistributing loads across phases, then checking phase currents to prove the redistribution worked rather than assuming it did.
Component replacement is the answer for a breaker or switch that keeps heating after it's been tightened, because repeated tightening on a failing device just resets the clock. Ventilation problems get solved by clearing blocked vents, adding airflow, or relocating equipment out of a hot corner.
Two rows need no repair at all. A reflection or solar artifact gets recorded as not confirmed with a clean image from another angle attached. That entry protects the budget as much as the building.
The closeout test
Verification is the column that turns a work order into evidence. A re-scan under comparable load showing the difference has moved into a lower band is the only proof that counts, and the load condition has to match the original scan or the comparison is meaningless.
Closeout test: the same asset, the same reference method, the same or higher load, and a smaller number.
For a fuller picture of how findings, actions and verification fit into a formal inspection document, see what a complete electrical inspection report includes.
Documentation and Closeout for Recurring Programs
An annual one-off scan produces a photograph album. A program produces a baseline. The difference is written into the standard.
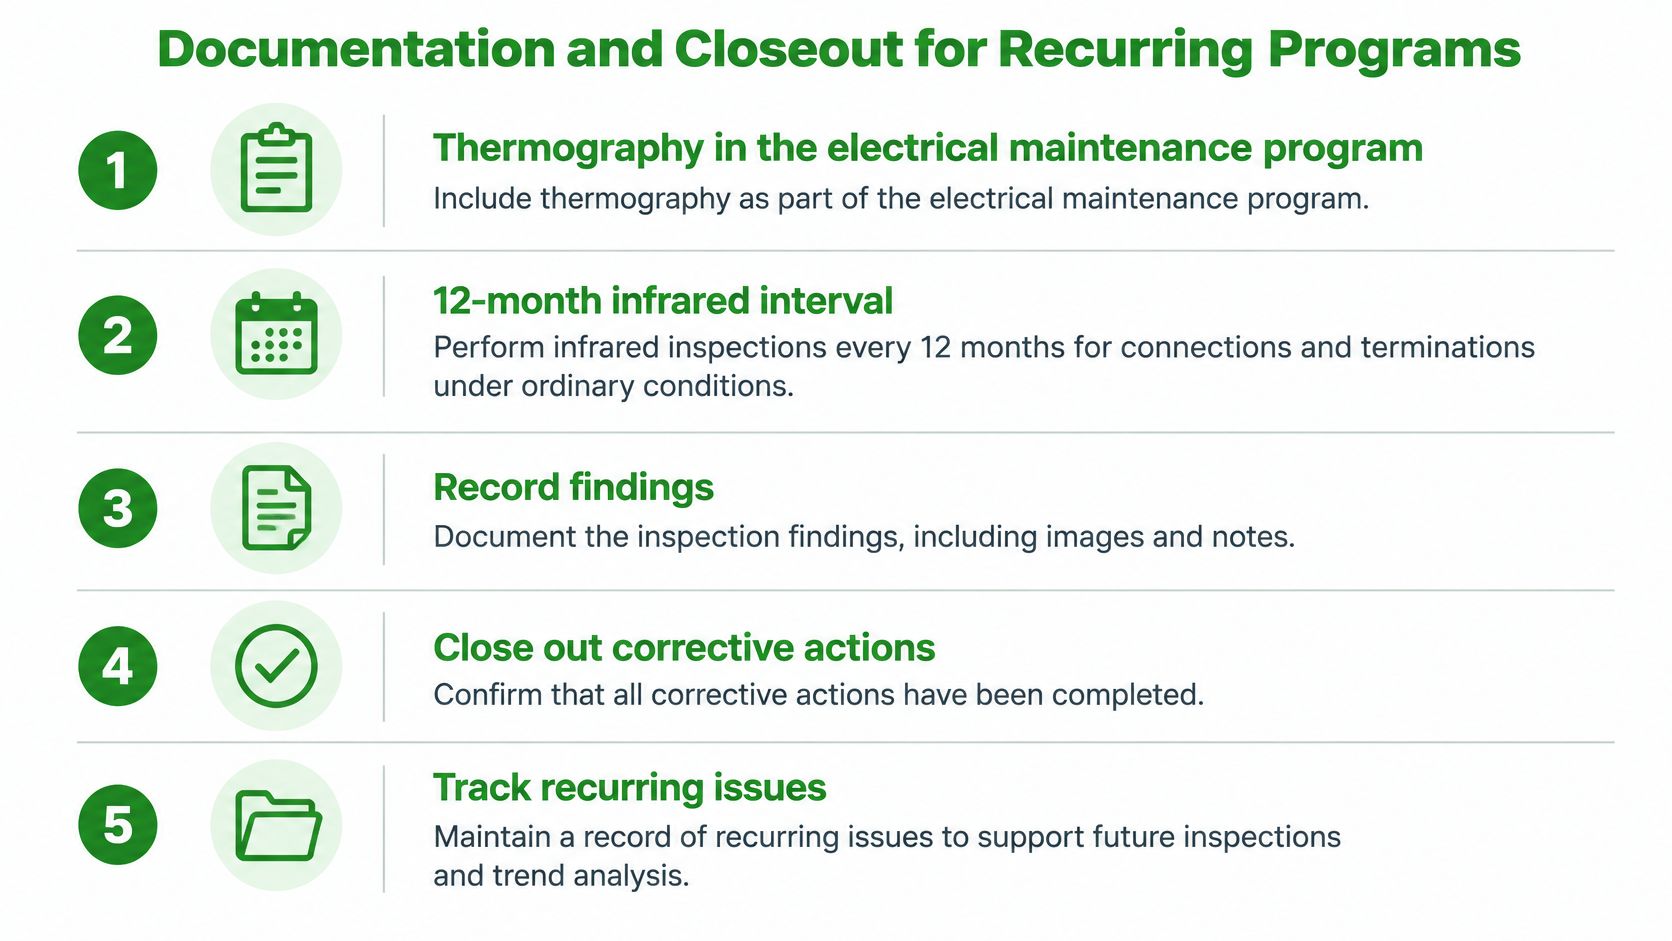
The 2023 edition of NFPA 70B treated infrared thermography as an integral element of electrical-equipment maintenance programs rather than an optional best practice. Its maintenance tables specify a 12-month interval for infrared inspection of electrical connections and terminations under ordinary conditions, and six months where equipment conditions are more adverse (NFPA 70B). The same standard requires the inspection to follow its dedicated thermography provisions, including appropriate qualification and safe execution.
Those intervals fit a planned maintenance calendar for multifamily, retail, office, hospitality and industrial property. They also beat the alternative most buildings fall back on, which is calling someone after a breaker trips.
Shorten the cycle when the equipment earns it
Condition drives the number. A property that has missed maintenance cycles, recently completed a major repair, or logged a diagnostic alert has a reason to move to the shorter interval. Equipment history is part of the assessment, not a footnote to it.
A panel that was repaired last spring and re-scanned clean in summer doesn't necessarily wait a full year for the next look if something else about the gear has changed. Write the reason for the shortened interval in the file so the decision is visible later.
Four steps that turn reports into a program
- Give every recommendation a status of open, repaired or verified, and keep that status current.
- Attach the repair date and the re-scan result to the item when it closes, so the evidence travels with the record.
- Keep the baseline scan and compare each new one by asset ID, which is how a trend becomes visible across multiple years.
- Store the report with the asset records for the life of the equipment.
The client's side of that work runs alongside: the owner or facility manager supplies asset drawings, load data and access, and signs off the scope before anyone opens a panel. When those inputs are thin, the report gets thin with them.
The practical test for a program is simple. A manager should be able to open the file alone and see whether a hot spot flagged two years ago was fixed and verified, without calling the contractor to ask. Programs built this way also anchor the wider switchgear maintenance schedule, since the same asset list drives both.
Book an Infrared Inspection and Set the Re-Scan Date
Four steps separate a useful scan from a folder of colorful images.
- Ask for a sample report and test it against the required sections. Cover and scope, conditions with load, findings with paired thermal and visual images, a stated comparison basis, grades, recommendations and closeout status.
- Ask how severity gets assigned, and whether the documentation follows NFPA 70B and ASTM E1934 practice.
- Confirm the inspector's qualifications and the equipment used, and ask whether the provider runs load-documented scans plus a follow-up re-scan after repairs.
- Set scope and cadence together, with main distribution equipment on a 12-month cycle and higher-risk gear on six months.
If the purpose of the scan is still fuzzy, start with what electrical infrared testing is for and build the scope around that job.
The market behind this service is expanding, which makes the vetting step more important, not less. DataIntelo estimated the global thermography inspection services market at $4.8 billion in 2025 and projected $9.6 billion by 2034 (DataIntelo). More providers means more variation in what a report contains.
Access Electrical and Lighting runs Level Three infrared inspections and FLIR surveys across Orange County and the surrounding region, with documented reports built around exactly the sections above. You can request a free estimate by calling 949-364-6063 and book the scan against your own maintenance calendar.
Whether you hire us or someone else, do one thing before the report leaves the building: put the re-scan date on the calendar. A finding with no follow-up date is a note to yourself that you'll probably ignore.
A credible scan is judged by what it lets you prove six months later, and Access Electrical and Lighting builds infrared inspection reports around that idea: documented load conditions, paired thermal and visual images, stated reference points and severity grades you can act on. If your property needs a baseline for panels, switchgear or distribution equipment, the team can scope it and schedule the work. Visit Access Electrical and Lighting to get started.
