
Residential LED sales climbed from roughly 5% of the global market in 2013 to about 50% in 2022, according to the International Energy Agency. That arc explains why a retrofit conversation now starts with an LED lighting calculator instead of a catalog page. The efficient product is the default, so the burden of proof has moved to the numbers you feed the tool.
Calculators return a payback figure with great confidence. They never tell you the answer inherits the error of its weakest input. Guess a wattage, round the hours upward, or count fixtures from memory, and the result comes out clean, tidy and wrong by enough to break a capital budget.
Three things separate an estimate you can defend in front of an owner from one that collapses at the first site visit: measured fixture wattages, a life-cycle view that counts the maintenance you stop paying for, and an honest list of the costs a basic tool never asks about.
Typical Wattage Swaps for Common Commercial Fixtures
A retrofit estimate fails at the first guessed wattage. Before you open a calculator, build a fixture schedule with real counts and real wattages, and use known swaps to sanity-check what you find on site.
| Existing fixture | Typical old wattage | Typical LED replacement |
|---|---|---|
| Metal halide high bay, 400 W | 400 W | 150 to 180 W |
| Metal halide high bay, 250 W | 250 W | 90 to 110 W |
| High-pressure sodium wall pack, 150 W | 150 W | 45 to 60 W |
| 2-lamp 4-foot T8 fluorescent | 56 W | 22 to 36 W (tube or troffer kit) |
| 4-lamp 2×4 troffer | 112 W | 36 to 40 W (LED panel) |
Every figure in that table is a starting value for a budget conversation, not an input to a savings claim. Metal halide and high-pressure sodium fixtures vary by ballast type and lamp age, and fluorescent fixtures vary by ballast factor. A warehouse full of 400 W metal halide high bays is a common starting point for a retrofit, and high bay warehouse lighting guidance helps you match beam angle and mounting height to the new wattage so the delivered light holds up.
Read the ballast, not the lamp
The number printed on a lamp is the lamp load. The number your meter sees includes the ballast, and on an older magnetic ballast that gap is not small. Open the fixture, find the ballast label and read the input watts line, or clamp a meter on the circuit and record its draw. Ten minutes with a clamp meter on one fixture per group beats an afternoon of arguing about a discrepancy later.
LED products have the same split. Spec sheets list a driver rating and often an input power figure. Use the input power, because that's the load you're paying for and the one that determines whether the connected lighting power density clears the energy code.
Watts don't light a room, lumens do
Two LED fixtures with identical wattage can put very different light on a work surface. The only comparison that matters is delivered foot-candles at the task, which depends on lumen output, beam angle, mounting height, surface reflectance and the maintenance factor you apply for lumen depreciation and dirt.
Set up the comparison the way a designer does. Take the target light level for the space, multiply by the floor area, then divide by the usable lumens per fixture after utilization and light loss. If the proposed fixture clears that bar at the same task height, the wattage drop is real savings. If it doesn't, you've bought a darker room and a maintenance complaint.
Record it once, use it six times. For every fixture group, write down the old wattage, the new wattage, the count and the annual hours. Those four numbers feed the energy calculation, the demand calculation, the labor estimate and the bid package.
The value of that row on a spreadsheet is not bookkeeping. It's the moment a reviewer asks what happens if the LED draws 5 W more than the spec sheet claimed, and you can answer in seconds because the assumption was written down instead of remembered.
Calculate Annual Energy and Cost Savings
The first answer a property manager wants is annual kilowatt-hours and dollars. It comes from one line of arithmetic, and lighting is still worth the effort at portfolio scale. DNV's 2025 study of 11 utilities and program administrators in the United States and Canada found that lighting-efficiency opportunities across North America could produce more than 3,700,000 MWh of savings.
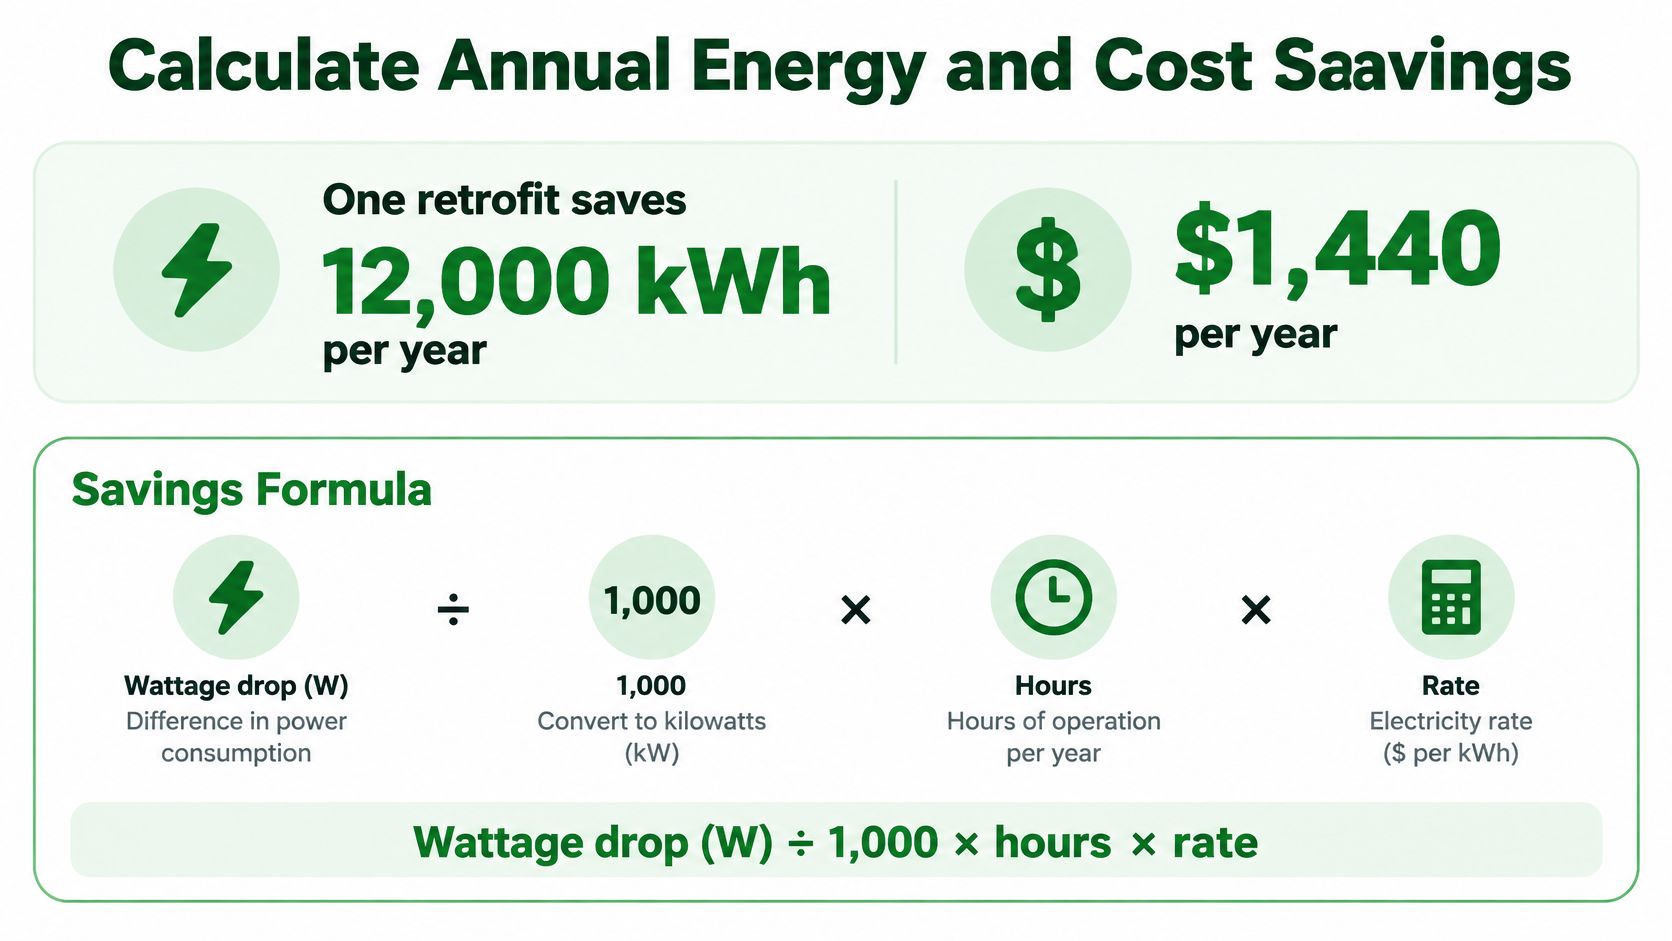
The formula in one line
Take the wattage drop per fixture, divide by 1,000 to convert to kilowatts, multiply by annual operating hours, multiply by the electricity rate per kWh, then multiply by the fixture count. Written out, that's (old W − new W) ÷ 1,000 × hours × rate × fixtures.
Nothing in that expression is hard. The failure modes live entirely in the inputs, which is why a good LED lighting calculator asks for each one separately instead of hiding it behind a default.
The same numbers, line by line
Say a property has 100 fixtures running 4,000 hours a year, moving from 150 W to 60 W at $0.25 per kWh, with an installed cost of $25,000.
| Line item | Value | How it is calculated |
|---|---|---|
| Wattage drop per fixture | 90 W | 150 W − 60 W |
| Annual operating hours | 4,000 hours | About 11 hours a night, every night |
| Energy saved per fixture | 360 kWh per year | 90 W × 4,000 h ÷ 1,000 |
| Energy saved, all fixtures | 36,000 kWh per year | 360 kWh × 100 fixtures |
| Electricity rate | $0.25 per kWh | Energy charge from your utility bill |
| Annual cost savings | $9,000 per year | 36,000 kWh × $0.25 |
| Installed LED cost | $25,000 | Contractor quote for 100 fixtures |
| Simple payback | 2.8 years | $25,000 ÷ $9,000 |
Run the same sequence for your own fixture count and hours before you do anything else with the number. It takes about four minutes, and it tells you whether the project is even worth surveying.
Where each input comes from
- Old wattage: the ballast label or a clamp meter reading, not the lamp stamp.
- New wattage: the LED spec sheet's measured input power, including driver losses.
- Hours: whatever the time clock, photocell or building schedule does, including weekends and the hours nobody wants to admit the lights stay on.
- Rate: the energy charge line on the bill, in dollars per kilowatt-hour.
The schedule matters more than expected. A parking lot on a dusk-to-dawn photocell runs longer than an office on a 12-hour timer, and a stairwell on 24-hour operation runs longer still. Pull the setpoints from the control panel rather than assuming them.
Rate rule: use the energy charge only. Blending demand charges and fixed fees into a single dollars-per-kWh figure inflates the savings line and makes the model disagree with the meter later.
When you've finished the arithmetic, compare the annual dollar result against one month of utility bills for the same account. If the savings look implausible against a real invoice, the error is almost always in the hours or the fixture count. For contractors assembling the physical scope, LED retrofit kits for contractors are where wattage, lumen output and driver quality get locked in before an order goes out.
How to Build a Life-Cycle Payback Check
Annual savings are half the decision. The other half is what you stop spending on the old system, and that's where a simple payback understates the case.
The ENERGY STAR lighting calculator workbook published by the U.S. Environmental Protection Agency and Department of Energy treats a lighting decision as a life-cycle cost model rather than a wattage converter. It estimates electricity consumption, operating cost and replacement cost against a conventional baseline, then nets out the efficient product's additional purchase price. That structure is the right one for commercial retrofits because it captures fixture quantity, wattage, operating hours, electricity price, product life and replacement assumptions in a single view. A low purchase price can conceal higher long-term electricity and maintenance costs, which is exactly the trap an office, retail property, multifamily building or parking structure needs to avoid.
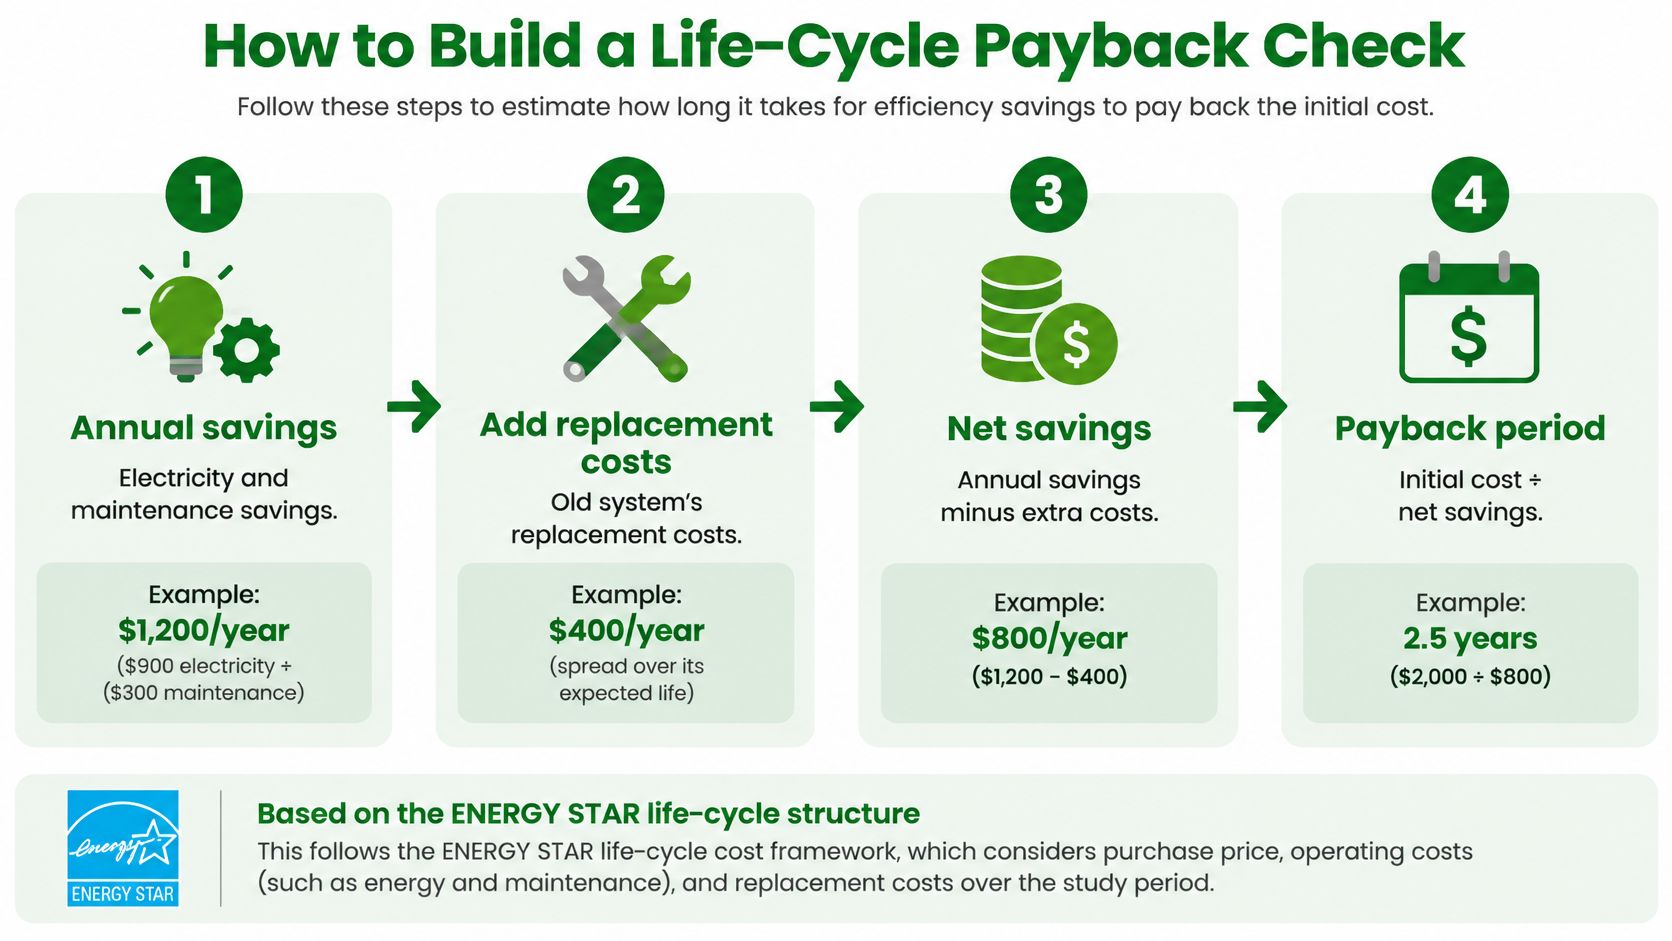
The six steps
- Group the fixtures. Type, count, old wattage, new wattage, annual hours. One row per group, no averaging across fixture families.
- Calculate kWh and dollars per group, then sum. Group-level math protects you when one fixture type carries most of the savings and the rest barely pay for themselves.
- Estimate avoided lamp and labor costs. Say a metal halide lamp gets replaced every 3.75 years at $120 per fixture including lift time. That's about $32 per fixture per year the property stops spending, and it lands in the same year-by-year column as the electricity.
- Add the maintenance you avoid but don't schedule. Fewer after-hours outage calls, fewer emergency dispatches, fewer partial dark zones in a parking structure. If the old system generated nuisance failures, that cost belongs in the model.
- Subtract rebates from installed cost. Utility programs still fund lighting, as the scale of identified North American savings suggests. Net cost is what you divide, not gross.
- Divide net cost by total annual savings, then run the same net savings over the LED's expected life. The second number is the one a finance committee approves against.
Two errors that quietly kill the case
Leaving rebates out makes a fundable project look marginal. Using the LED's rated life without allowing for driver failures makes it look better than it is. Rated hours assume a stable operating temperature and healthy electronics, and a hot high bay ceiling or a fixture that cycles constantly can shorten real service life well below the label.
If the payback lands anywhere near the LED's rated life, cut scope or renegotiate price. A project that only pays back over its own service life isn't a savings project, it's a replacement with extra steps.
For a broader view of how the same discounting logic applies to roofs, chillers and other capital assets, these worked examples of asset lifecycle costing from Facility Management Insights follow the identical structure of annual savings, avoided replacement, net cost and payback.
Costs and Conditions a Simple Calculator Misses
The number a basic calculator returns assumes the retrofit changes nothing except the lamp. Real buildings rarely cooperate with that assumption, and the gaps don't all push in the same direction.
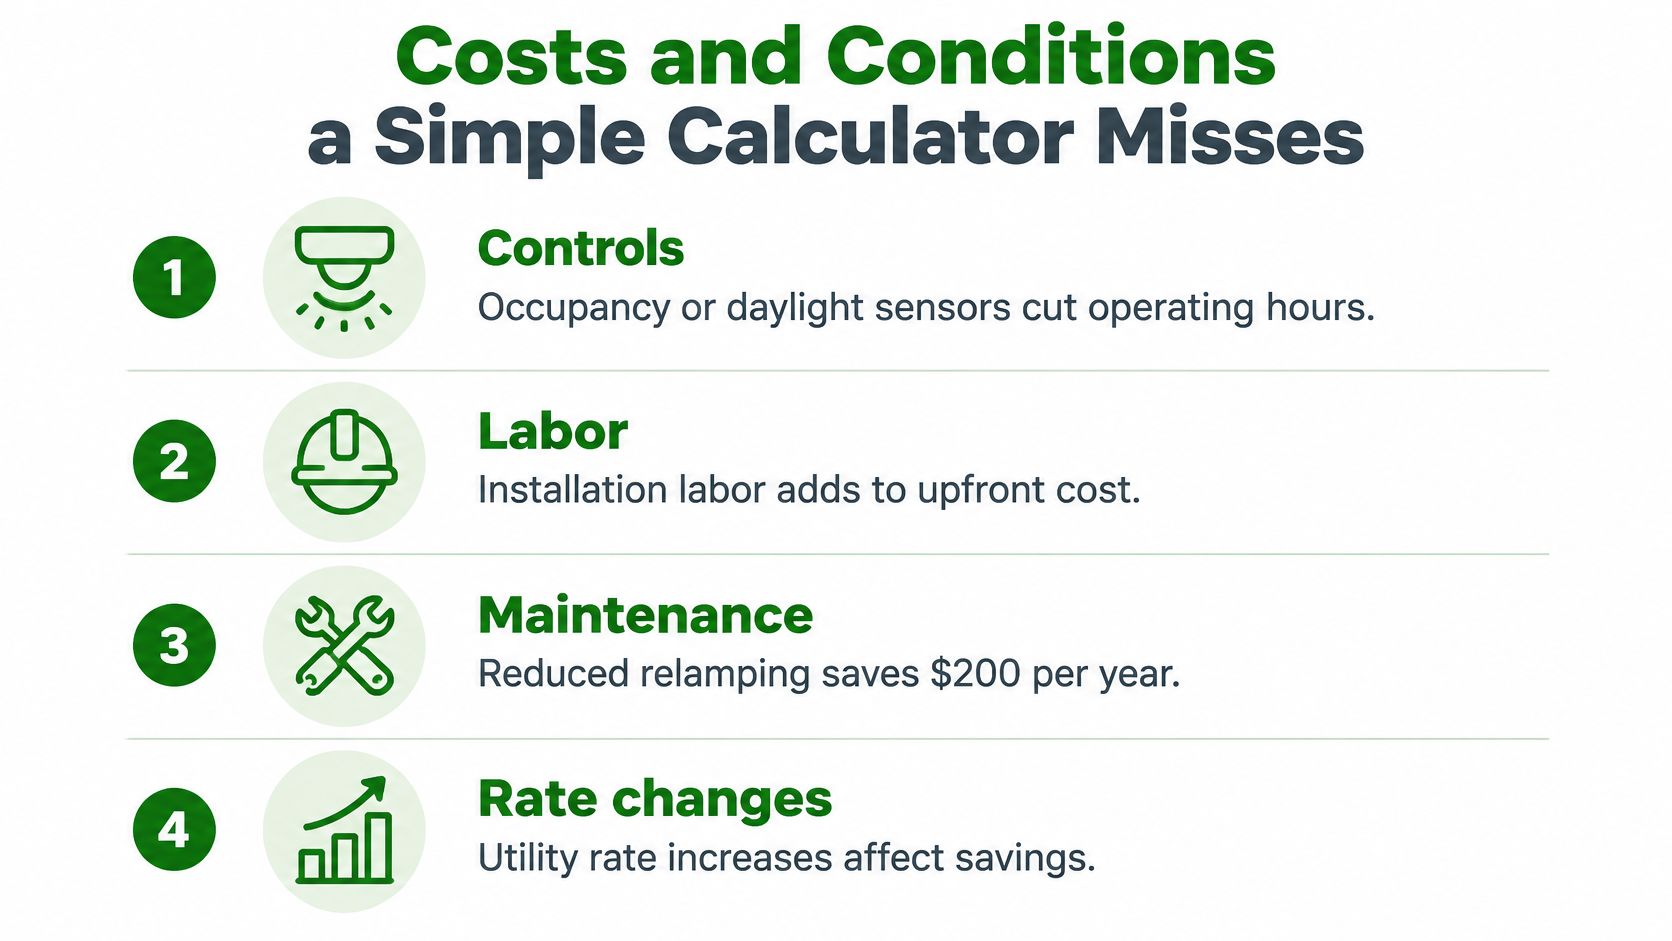
Start with what the technology can deliver. The IEA's analysis of the LED transition reports typical LED savings of 50–60% versus fluorescent and 80–90% versus incandescent, while also noting higher upfront cost and the importance of quality and performance criteria. That's the ceiling on the savings side, and it's set by the baseline you're replacing, not by the calculator.
Where the estimate drifts, and which way
- Controls. Occupancy or daylight sensors on parking, stairwell and restroom fixtures cut operating hours sharply. A fixture-only estimate understates the case, so run fixture-only and fixture-plus-controls scenarios side by side and let the owner choose. Access Electrical and Lighting installs lighting control systems with the retrofits themselves, which keeps the sequence and commissioning in one scope.
- Delivered light. Dropping 150 W to 40 W can pass a wattage test and still leave dark corners, low foot-candles at a loading dock or uneven coverage in a rack aisle. Under-lighting brings tenant complaints, safety exposure and rework, all of which push payback in the wrong direction.
- Access equipment. A boom truck day for high bays or pole heads can cost more than several of the fixtures on the truck. Labor for access belongs on its own line, separate from per-fixture installation.
- Demand charges. Cutting connected kilowatts doesn't reduce a demand charge at the same rate as the energy line, especially when other loads set the monthly peak. Model the demand line separately or leave it out and be explicit about it.
- Emergency lighting. Fixtures that must stay lit for code, including exit signs and battery-backup units on 24-hour circuits, don't get the same hours reduction as general lighting. Counting them in the savings total inflates the case.
- Real service life. Rated hours assume a set operating temperature and healthy drivers. Hot fixtures and frequent cycling shorten both, which stretches payback beyond the spreadsheet.
The contrarian finding is uncomfortable for anyone optimizing on wattage. The highest-return retrofit isn't always the lowest-wattage fixture, because reducing output too aggressively creates illumination failures that cost more to fix than the saved energy is worth. A retrofit that has to be revisited in eighteen months has no savings at all.
The useful question isn't "what's the lowest wattage that works." It's "what is the lowest total cost of ownership that still meets required illumination, safety, code and operational reliability."
Checking Estimates Against Your Utility Bill
An estimate that never gets reconciled with a meter is a guess with formatting. Before the number reaches a budget meeting, run it against real consumption.
Four input errors that survive a quick review
- Nameplate wattage used as load. The fixture draws more than the lamp stamp because of ballast or driver losses, and the error compounds across every fixture in the group.
- Photocell and timer hours merged into one figure. Fixtures on different schedules need different hour inputs, or the blended average misses both.
- Fixture counts taken from a floor plan. Plans and reality diverge, especially in warehouses with added racks and retail spaces with tenant revisions.
- Hours assumed rather than read. The schedule on the panel is the schedule to model, including the two hours before opening that nobody budgets for.
The reconciliation test
Compare the model's monthly kWh for a fixture group against one month of past bills covering the same loads. Treat a gap under about 10% as ordinary noise from weather, occupancy and meter timing. Treat anything larger as a signal, and look at hours first, then wattage. Hours are wrong more often than wattages are.
The sensitivity test
Change the hours by 10%, note how far payback moves, then reset and change the rate by 10%. Whichever variable swings the answer harder is the one that deserves a site measurement instead of an assumption. On most commercial projects that variable is hours, and the fix is a time clock review rather than an argument about fixtures.
Under time-of-use pricing, a kWh saved at 3 a.m. is worth less than a kWh saved at 4 p.m. A dusk-to-dawn parking light and an office light can produce identical kWh savings with very different dollar savings.
That's the practical form of the principle: an estimate is only as accurate as its weakest input, and the weakest input is usually a schedule. Retail and mixed-use properties carry an extra wrinkle, because display lighting and commercial lighting for retail spaces often run on separate controls from back-of-house, so the two need separate rows in the model.
Confirm Your Retrofit Numbers Before You Approve
The decision rule is simple. If the verified payback fits the capital budget and the verified light levels meet the target, approve the scope. If either fails, ask for a smaller fixture-plus-controls option before signing anything.

What gets you to a verified number is a site survey, and it needs four things in hand:
- A fixture schedule with counts, types and mounting heights, grouped the way the calculator expects.
- Current operating hours pulled from timers, photocells and control schedules rather than from memory.
- Twelve months of utility bills, with the energy rate and demand structure visible.
- Any applicable rebate or program paperwork, so net cost reflects reality.
A lighting survey measures brightness levels, checks fixture placement and records energy consumption, which is how the old wattage, the light levels and the hours all get confirmed on site instead of assumed in an office. That's the step that converts a spreadsheet estimate into a figure an owner can approve.
Access Electrical and Lighting offers complimentary lighting surveys that assess a property and recommend the most energy-efficient lighting solutions for it, along with free estimates, and serves commercial properties in Orange County, California.
One caution before you compare bids. Two quotes with the same payback can carry very different risk, because one may assume delivered light the fixtures can't produce at the listed spacing. Ask each bidder to show the lumen output, the maintenance factor and the assumed hours behind their number. The lowest payback built on the softest assumptions is the most expensive project in the room.
A verified payback beats an optimistic one every time, and getting there means measuring the fixture, reading the schedule and pricing the access. Access Electrical and Lighting runs complimentary lighting surveys for commercial, retail, multifamily and office properties across Orange County, checking wattages, light levels and operating hours so the savings figure you take to an owner is one you can defend. Reach out for a free estimate and we'll model your actual fixture counts, controls and utility rate before anything gets ordered. Visit Access Electrical and Lighting to schedule a survey.