The most common advice about lot lighting is to aim for roughly a footcandle across the pavement, divide your total lumens by the lot area, and buy the fixture count that pops out. That single number has produced more bad parking lots than any other shortcut in the trade. An average is a summary, and a summary can be satisfied by a site that's bright directly under each pole and close to black in the stalls between them.
A parking lot lighting calculator that returns only fixture count and average footcandles answers a question nobody asked. The questions that decide whether a lot works are narrower and harder. Can someone walking between two parked cars be recognized from forty feet away? Does the layout hold a measurable minimum at the far corner, or does the light pool under the pole heads? Does the energy model survive contact with a photocell and an occupancy sensor?
Here's the sequence I'd run on a real site: write the targets down before touching software, collect inputs you can defend, build a point-by-point grid, read the output in the order a reviewer would, then check glare, boundary spill and the power model. Skip any of those and you get a design that passes on paper and generates complaints after dark.
Design Targets Every Lot Calculation Must Meet
Average illuminance doesn't prove a lot is safe. It proves the arithmetic worked. The U.S. Department of Energy parking-lot guidance splits criteria into basic and enhanced-security tiers, and each tier carries four numbers a competent calculator has to report. The DOE defines illuminance as the light falling on a horizontal or vertical surface, measured in footcandles in the United States, where 1 footcandle equals 1 lumen per square foot.
| Criterion | Basic parking | Enhanced security |
|---|---|---|
| Average horizontal illuminance (preliminary design) | 1 footcandle | 2.5 footcandles |
| Minimum horizontal illuminance | 0.2 footcandles | 0.5 footcandles |
| Maximum-to-minimum uniformity ratio | 20:1 | 15:1 |
| Minimum vertical illuminance | 0.1 footcandles | 0.25 footcandles |
The average is a sizing aid, not a compliance value. The minimum is the number that decides whether a stall or a walkway corner is dark. Uniformity is calculated as maximum divided by minimum, so a wide ratio means visible pools and shadows even when the average looks generous. Vertical illuminance is the one most reports skip, and it's the one tied to whether a face or a moving figure reads against a background.
Three formulas sit behind every number in that table. Lumen-method average illuminance equals the number of fixtures times lumens per fixture times the utilization factor times the light-loss factor, divided by lot area in square feet. Maintained illuminance equals initial illuminance times the light-loss factor, which carries lamp and optics depreciation plus dirt. Uniformity ratio equals maximum illuminance divided by minimum illuminance across the calculation grid. Check units every time, since 1 footcandle is 1 lumen per square foot, and mixing lux into the sheet breaks the comparison.
Practical rule: Write your target set down, with the site category next to it, before you run a single model. A passing result only means something if you defined what it passed against.
Where a local code applies, it overrides the federal baseline, so pull the local parking lot lighting standards for the site before committing to targets.
Gather the Inputs Before You Open the Calculator
A calculator is only as honest as what you feed it. Collect these in the order you'd walk the site, and record the source of each one so you can tell later which results are measured and which are assumptions.
- Boundary and use zones. Mark drive aisles, parking bays, pedestrian routes, crosswalks, building entrances and the property line. Each zone can carry a different target.
- Pole geometry. Location, spacing, mounting height and tilt for every head. A two-foot change in height can reshape the pavement pattern more than expected.
- Obstructions. Trees, canopies, signs and building overhangs that will throw shadows across the grid.
- Photometric files. Get the manufacturer's tested IES file for each candidate fixture. Nominal lumens describe quantity, never distribution.
- Pavement type. Asphalt and concrete reflect differently, and the difference shows up in the average.
- Maintenance factor. A light-loss factor covering dirt and output depreciation across the maintenance cycle rather than a fresh-lamp assumption.
- Control schedule. Operating hours, photocell behavior, dimming states and occupancy timeout.
Two inputs get guessed wrong more than any others. Pavement reflectance is left at whatever the software defaults to instead of being specified as asphalt or concrete, and the light-loss factor is left at 1.0, which assumes a fixture that never gets dirty and never depreciates. Both errors push the model optimistic in the same direction.
Mark each input as measured, specified, or assumed. Anything assumed is a result that needs field verification later, and knowing which is which saves you from arguing about the wrong number after installation.
How to Run a Point-by-Point Illuminance Calculation
Point-by-point is the only method that produces a minimum value you can defend. A lumens-per-square-foot multiplier can't, which is why the IES roadway lighting guidance treats lighting quality as more than illuminance and uniformity, with glare and visual contrast for pedestrians, hazards and vehicles evaluated alongside them. Here is the sequence.
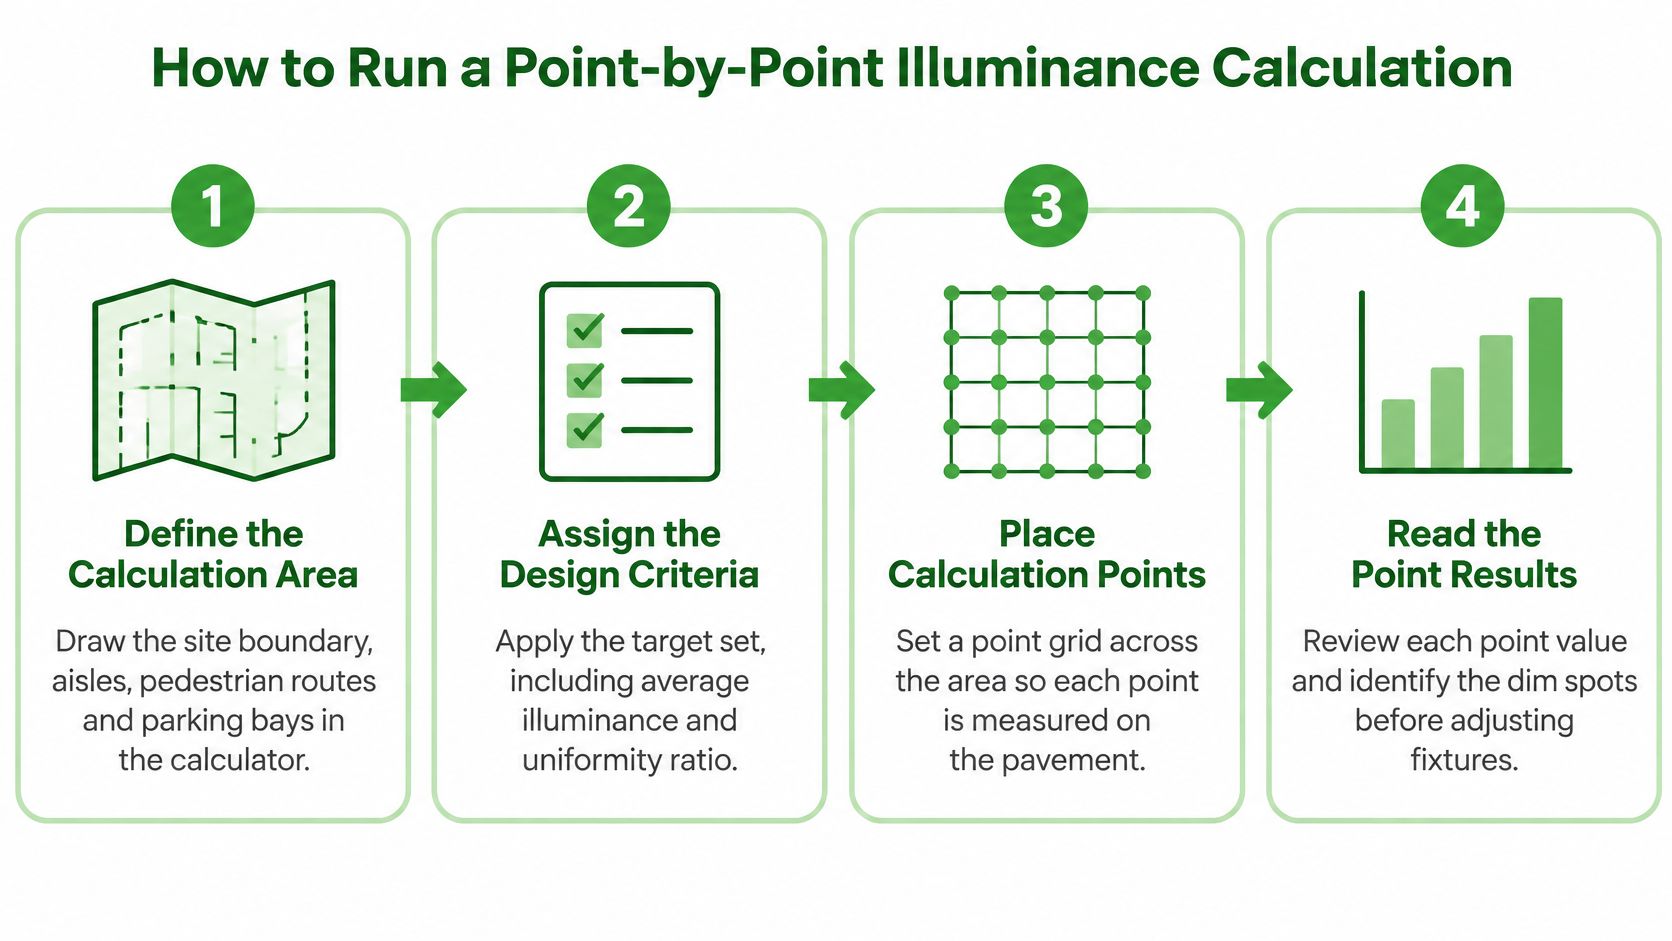
The Six Steps in Order
- Define the calculation area. Draw the boundary, aisles, pedestrian routes and bays in the tool. Skipping the pedestrian routes is the quiet error here, because they then get no criteria attached.
- Assign the design criteria. Load your target set: average, minimum, uniformity, plus glare and spill limits. A model with no failure threshold can't fail.
- Import photometry and place poles. Use the tested IES file for each fixture at the planned height and spacing. Selecting fixtures by nominal lumens is the mistake at this step, since two 20,000-lumen heads with different distributions produce different uniformity and different boundary spill.
- Build the grid. Denser points at entrances, crossings, ramps and edges. A uniform coarse grid averages away exactly the dark corners you're hunting.
- Read average, minimum, maximum, uniformity, vertical illuminance and trespass. Review calculated minimums, not averages, because that's where safety lives.
- Iterate, then plan a field check. Adjust spacing, height, optics, output or controls and rerun until everything passes, then verify representative points with a meter after installation.
A foot candle calculator is a reasonable first pass for the average level, but it won't tell you what the darkest point does. Treat it as a screening step, not the design.
What Belongs in the Project File
Save the input set with its sources, the photometric file names, the grid resolution, the criteria sheet, and the final average, minimum, maximum, uniformity and vertical results. Add the energy summary alongside them. When an owner or a plan reviewer asks why a lot was laid out a certain way, that file answers in one page.
Reading a Six-Pole Lot Result From Start to Finish
Say a 200 by 300 foot lot with six poles at 25 feet mounting height and 90-foot spacing. The numbers below are illustrative, but the reading order is the one I'd use on any real submittal. Six fixtures at 20,000 lumens each, a utilization factor of 0.5 and a light-loss factor of 0.8 over 60,000 square feet gives 6 × 20,000 × 0.5 × 0.8 ÷ 60,000 = 0.8 footcandles, which misses the 1 footcandle preliminary target.
| Criterion | Basic target |
|---|---|
| Average horizontal (preliminary) | 1 fc target; 0.8 fc at 20,000 lm fails, 1.0 fc at 25,000 lm passes |
| Minimum horizontal | 0.2 fc |
| Maximum-to-minimum uniformity | 20:1 |
| Minimum vertical | 0.1 fc |
Reading the Output in Order
Start with the average against the target. That tells you whether you're in the right range at all. Then drop straight to the minimum at the darkest grid point, which on a six-pole layout is usually the far corner or the stall midway between two poles. A passing average hides that value completely, and it's the number a light meter will find first.
Divide maximum by minimum next and compare the ratio to your limit. Then check vertical illuminance at the pedestrian sightlines and spill at the property line. Four checks, four chances to catch a problem the average never reveals.
When a Criterion Fails
Raising output to 25,000 lumens per fixture gives 6 × 25,000 × 0.5 × 0.8 ÷ 60,000 = 1.0 footcandle, which clears the average. But that fix costs energy on every operating hour, so price the alternatives first. Pulling poles closer together, changing to a wider distribution, or dropping mounting height slightly can lift the minimum and tighten uniformity for less connected load than a blanket output increase.
Brightening the whole lot to rescue one dark corner is the most expensive way to solve a uniformity problem.
A result that clears every target still needs a meter at representative points after installation. The same reading order scales to a much larger lot, you just tighten the grid spacing and add more calculation points along the edges.
Checking Glare, Spill Light and Pedestrian Visibility
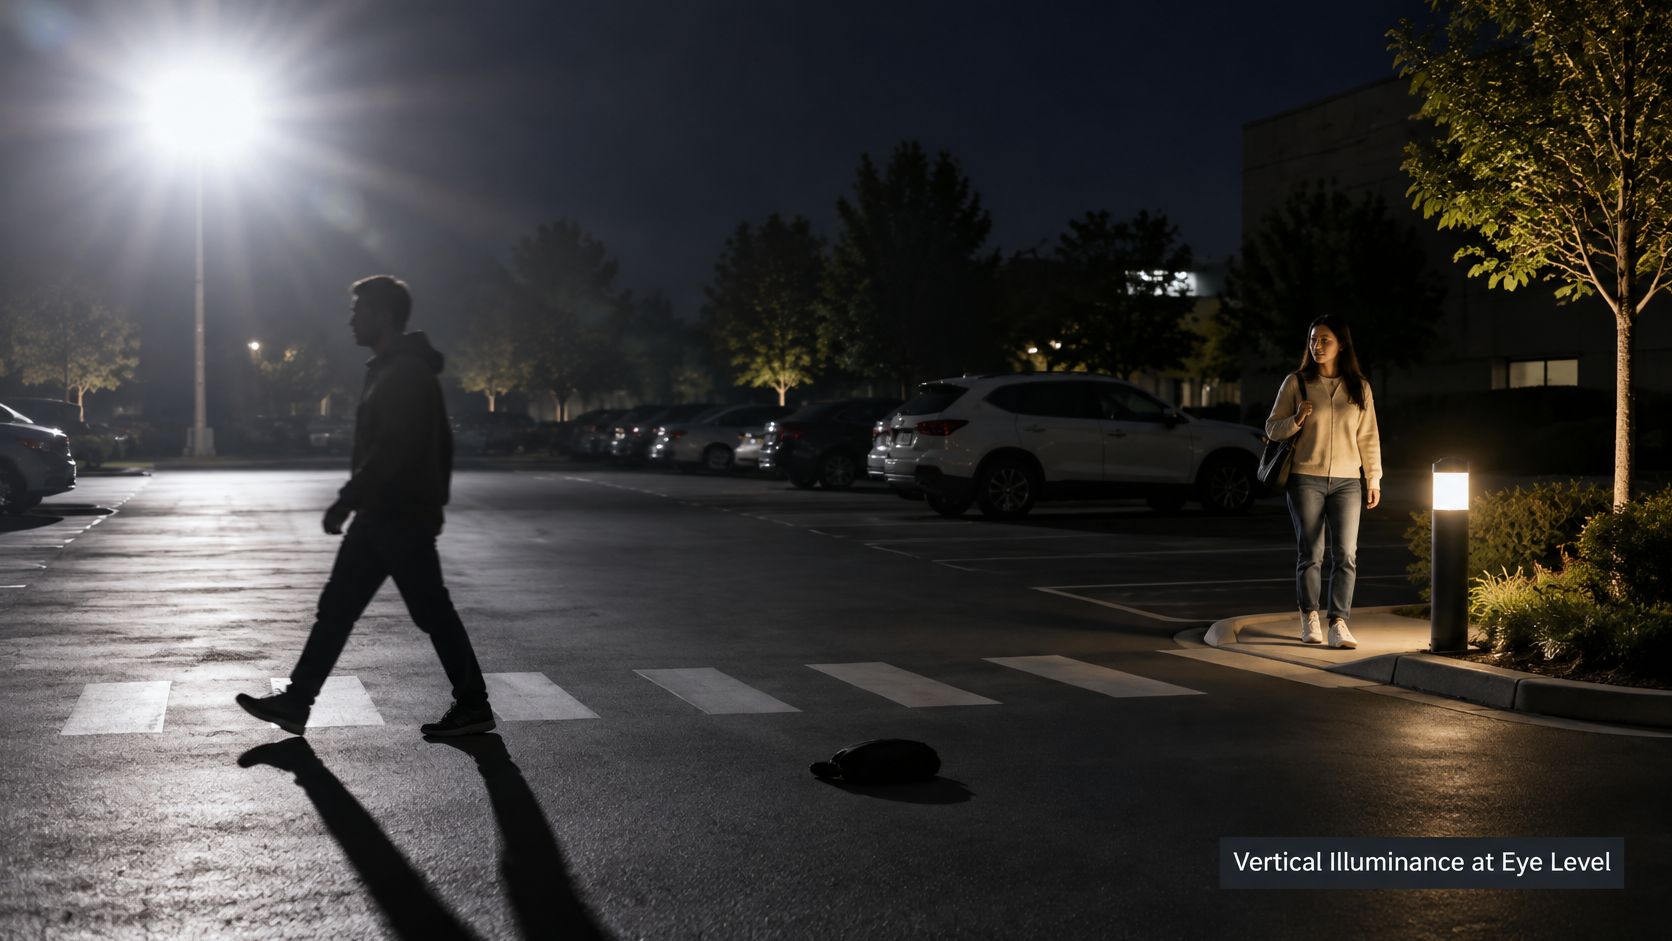
A driver who can't pick out a pedestrian at the edge of the lot has a lighting problem no average footcandle reading will catch. Most calculator output reports horizontal light on pavement, which says nothing about whether a face, a curb or a hazard is visible. The Pacific Northwest National Laboratory notes that incorrectly aimed lighting creates glare that interferes with identifying people or objects, and that full output is often needed only during occupied or high-traffic periods.
Local codes layer their own constraints on top of whatever target you set. Many jurisdictions write their own horizontal minimums, uniformity caps and property-line spill limits into the lighting ordinance, so pull the rules for the specific site before you finalize the layout. That last category fails more designs than any other: a layout that hits its average by flooding the perimeter still dies on trespass at the boundary.
More Lumens Can Make Visibility Worse
Adding fixtures or output can degrade the very thing you're trying to fix. Glare and contrast wash out the detail you want to reveal, and a driver facing an unshielded head loses the pedestrian standing just past it. Better optics, shielding, tighter aiming and controls matched to occupied hours usually produce a safer result with less total light.
Mounting height gets blamed more than it deserves. At eye level an unshielded luminaire is more glaring, not less, so cutoff classification, aiming angle and shielding decide the outcome more than pole height alone.
A Visibility Checklist Before You Order
- Vertical illuminance at pedestrian sightlines, measured at face height rather than at grade.
- Dark zones flagged on the point-by-point output instead of folded into the average.
- Zones separated, with drive aisles, accessible routes, crosswalks, stalls and entrances each held to their own target.
- Boundary spill estimated at every property line abutting residences.
- Glare reviewed by aiming angle, with extra scrutiny on poles near the entrance drive where eyes are still adjusting from darker surroundings.
Adding Energy, Controls and Maintenance Estimates
Keep the power model separate from the photometric one, or the two contaminate each other. The ENERGY STAR parking lighting reference supplies benchmarks that work as screening checks, and its limits also define which control assumptions belong in the model.
| Benchmark | Value | How to use it |
|---|---|---|
| Open parking lot lighting power density | 0.037 W/ft² | Screening check, not a substitute for a compliant design |
| Enclosed or partially enclosed garage lighting power density | 0.11 W/ft² | Screening check for garage areas |
| Pole-mounted luminaires at or below 25 ft with no activity | At least 50% power reduction | Model the dimmed wattage and the occupancy percentage |
| Motion-based timeout for the reduction | Maximum 15 minutes | Set the timeout and false-trigger assumptions explicitly |
Limits like these turn control assumptions into design inputs: occupancy percentage, dimmed wattage, timeout length, false-trigger behavior and seasonal photocell hours. A sensor held at full output by passing traffic burns through the savings the schedule promised. Calculate connected load per luminaire as fixture input watts plus driver and control losses, then multiply by operating hours and the utility rate. Model photocell, scheduling, dimming and occupancy states separately rather than assuming full output from dusk to dawn, and pull the control method details from the property's automated lighting controls instead of defaulting to a fixed schedule.
That modeling discipline matters at scale. U.S. parking-lot lighting energy consumption fell about 21%, from 436 trillion British thermal units in 2016 to 344 trillion in 2018, as LED penetration grew, per the 2020 LED adoption report.
The Failures That Show Up Most Often
- Pole-mounted control losses left out of the connected-load figure.
- Occupancy savings overstated by assuming a busy lot through the night.
- Minimum-output requirements ignored, so a sensor dims a fixture into non-compliance.
- An energy saving treated as proof that illumination is adequate, which it never is.
Four Outputs to Report Separately
Report photometric compliance, connected watts, annual kWh and peak demand on their own lines. I'd add maintenance assumptions and payback the same way. Anything merged into a single "savings" figure can't be audited later, and a reviewer who can't separate the photometric verdict from the energy verdict will distrust both.
Confirm Your Numbers Before You Order Fixtures
Rerun the final layout using only verified inputs: the IES file for the chosen fixture, surveyed pole locations and heights, the specified pavement reflectance, and the maintenance factor. Check every row of your target set, keeping the photometric verdict separate from the energy verdict.
Compare connected watts, annual kWh, peak demand and payback from the controls model. If any input can't be confirmed, a missing IES file, an unverified pole position, an untested control schedule, mark the result provisional and book a light-meter check of representative points before purchase. Access Electrical and Lighting runs complimentary lighting surveys that assess brightness levels, fixture placement and energy consumption, and we can take those readings and compare the installed setup against your calculated targets.
The layout is ready to order when every target passes both the calculation and the field check. Not before.
If you want the calculated numbers confirmed against the pavement before fixtures get ordered, Access Electrical and Lighting provides complimentary lighting surveys that assess brightness levels, fixture placement and energy consumption across commercial, retail and multifamily properties in Orange County. We also handle the retrofit itself, from pole repairs and LED site lighting to the lighting control systems that make the energy model hold up. Visit Access Electrical and Lighting to schedule a free estimate, or call (949) 364-6063.