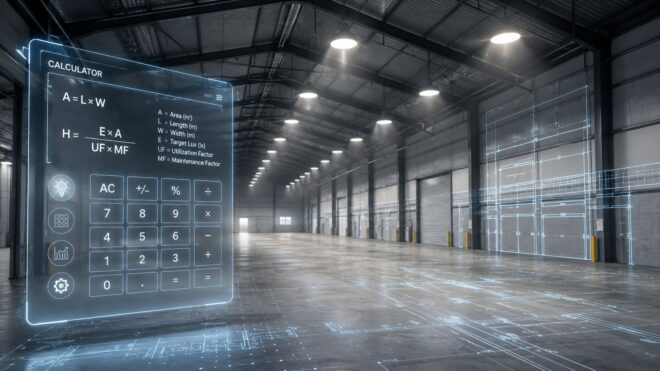
A facility manager is staring at a warehouse lighting quote that lists fixture quantities, wattages, and a total price, but no clear explanation of how the layout was chosen. The number might be close, or it might leave dark aisles, overlit perimeter areas, and a difficult conversation with the owner after installation.
A high bay lighting calculator gives you a defensible starting point. It turns the room's area, target illuminance, fixture output, and correction factors into a fixture estimate, then helps you think through spacing and operating cost. The important qualification is that a calculator produces a planning result, not a finished photometric design.
What a High Bay Lighting Calculator Actually Does
A high bay quote can show fixture quantities and wattages without explaining how the layout was selected. A high bay lighting calculator gives that number a traceable basis. It applies the lumen method, relating the required light at the work plane to room area and each luminaire's usable output. The main inputs are target illuminance, area, fixture lumens, coefficient of utilization, and light loss factor, as shown in this lumen-method lighting layout reference.
In practice, the calculator helps you:
- Estimate fixture quantity: It converts the selected target and fixture performance into a preliminary count.
- Set the room's lumen requirement: It combines target illuminance with floor area.
- Test a preliminary grid: It suggests approximate spacing, which must be checked against bay dimensions, aisles, racks, and obstructions.
- Compare fixture options: You can change lumen packages, optics, or fixture types and see how the estimated count responds.
That makes the tool useful for reviewing a quote, budgeting a retrofit, or comparing a linear high bay with a UFO-style fixture. It also gives a facility manager a practical way to question a fixture count that has no visible design basis.
Practical rule: Use the calculator result to start the layout review, not to approve the installation by itself.
A fixture count can still miss a blocked beam, a dim wall perimeter, or poor aisle uniformity. Those outcomes depend on mounting height, spacing-to-mounting-height ratio, optic selection, rack orientation, and the fixture's photometric file. A sensible workflow therefore uses the lumen method for quantity, then checks whether the proposed grid distributes light properly across the actual floor plan. That layout is easier to defend, and it gives energy and ROI comparisons a realistic starting point.
Key Lighting Terms You Need Before You Calculate
A calculator becomes useful only when each input matches a condition in the building. Start by separating the light delivered to the work surface from the light produced by the fixture.
Illuminance is the light arriving at a floor, rack face, or packing bench. U.S. layouts commonly use footcandles, with one footcandle representing one lumen distributed across one square foot. Lux is the metric equivalent used in many other markets.
Lumens measure the total visible light produced by a fixture. A higher lumen package does not automatically produce a better warehouse layout. Beam distribution, mounting height, CU, and LLF determine how much of that output reaches the work plane.
Efficacy is the lumens produced per watt. Use it to compare the electrical demand of fixtures with similar light output, while checking the actual lumen package and optics. Equal wattage can produce different light levels and coverage.
CRI, or color rendering index, indicates how naturally a source reveals colors against a reference source. It carries more weight in retail, inspection, sorting, and detailed work than in basic storage, where accurate color recognition may have less effect on the task.
The two inputs that often receive the least attention are coefficient of utilization, or CU, and light loss factor, or LLF.
- CU: This estimates how effectively fixture light reaches the work plane after accounting for room geometry, mounting height, fixture distribution, and surface reflectance.
- LLF: This represents the expected reduction in usable light from dirt, aging, and operating conditions.
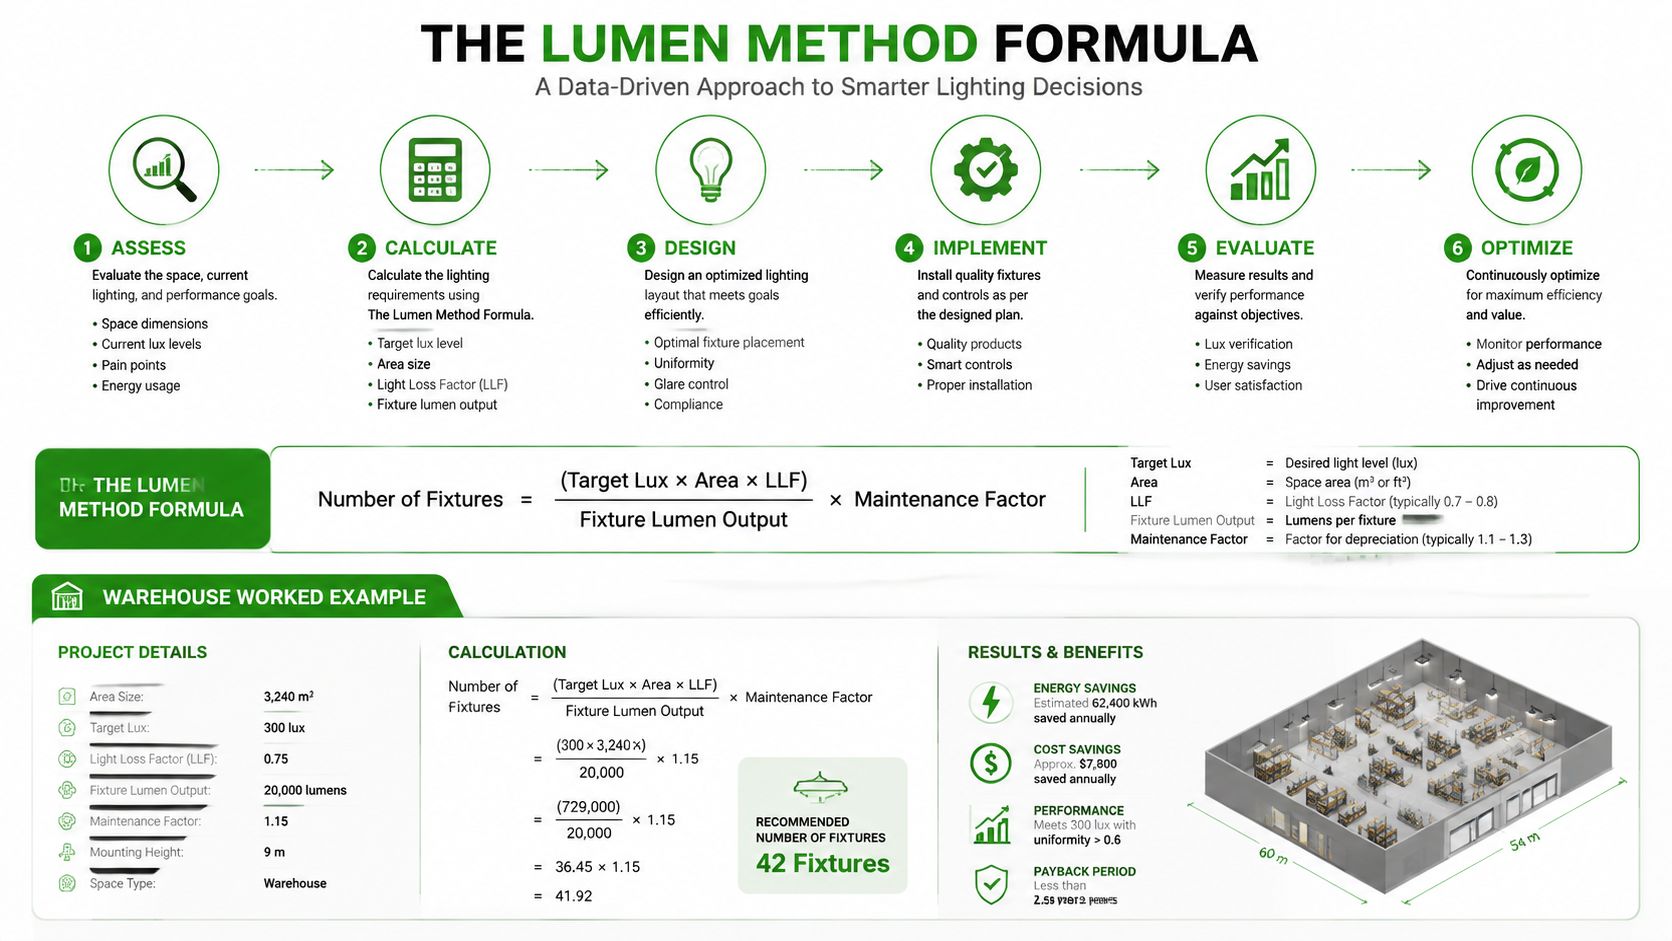
The lumen method uses these inputs in the relationship Number of Fixtures = (Desired Illuminance × Room Area) ÷ (Lumens per Fixture × CU × LLF). The result gives a starting quantity, not a defensible layout by itself. Check the proposed grid against mounting height, spacing, aisle position, obstructions, and uniformity before approving fixture count.
For a first pass, use the CU and LLF values supplied by the fixture manufacturer or lighting software. If project information is missing, avoid an optimistic default. A dirty room, dark ceiling, tall bay, blocked distribution, or demanding maintenance schedule can reduce useful light, so the final design should reflect those conditions. That discipline also makes later energy and ROI comparisons more credible.
Choosing the Right Footcandle Target by Space Type
A storage bay and a retail picking area can have the same floor area yet need different light levels. The right footcandle target depends on the visual task, circulation pattern, product detail, and safety exposure. Use a foot-candle calculator to test the target against area and fixture output, then verify the result against project requirements.
The table provides qualitative planning ranges for early high-bay discussions. It does not replace task analysis, an applicable project standard, or review by the authority having jurisdiction.
| Space Type | Target Footcandles | Notes |
|---|---|---|
| General warehouse storage | Around 30 fc | A starting point for relatively simple storage tasks. |
| Active warehouse aisles | Around 50 fc | A reasonable starting point where people and equipment work continuously in aisles. |
| Packing and detailed handling | Higher than general storage | Labels, product details, and inspection tasks may require more light. |
| Big-box retail | Around 50 to 70 fc | Product presentation and customer visibility may justify a brighter, controlled layout. |
| Gymnasium or recreation space | Around 50 to 75 fc | Uniformity and glare control matter alongside average light. |
| Manufacturing assembly | Around 50 to 75 fc | The required level depends on work size and precision. |
| Parking structure | Project and code dependent | Minimum requirements and emergency conditions may control the design. |
These ranges show why a facility manager should question a generic “lumens per square foot” shortcut. Task difficulty, visual contrast, occupant age, equipment movement, and safety conditions all affect the appropriate target. A higher average can still produce a poor installation if the layout creates dark aisles or excessive glare.
At 30 fc, the design requires less delivered light than at 50 fc, provided the area and other inputs stay unchanged. That difference affects fixture quantity, fixture output, energy use, and operating cost. The warehouse example later shows the relationship while keeping its assumptions visible.
For an Orange County project, California energy compliance should enter the discussion early. Review applicable requirements with the design and electrical team, rather than treating a basic calculator as a substitute for certification, controls, testing, or documentation. The Title 24 lighting requirements should be evaluated alongside the lighting layout.
Mounting Height and Spacing-to-Height Ratios
Mounting height is the geometric input that most strongly changes the visual behavior of a high-bay layout. Measure from the luminaire to the work plane, not just from the floor to the roof deck, especially when fixtures hang below structure or the task surface sits above the floor.
A practical classification is:
- Low bay: Under 20 feet.
- Standard high bay: 20 to 35 feet.
- High bay: 35 feet and above.
These bands aren't complete design specifications. They help you choose a starting optic, lumen package, and spacing approach. Lower installations often need broader distribution and closer control, while taller spaces may need more concentrated optics, greater output, or both.
The spacing-to-mounting-height ratio, written as S/MH, compares the distance between fixtures with the mounting height above the work plane. Independent high-bay calculator guidance identifies a common starting range of roughly 1.0 to 1.5, with the exact result dependent on the fixture photometry and room arrangement (high-bay spacing guidance).
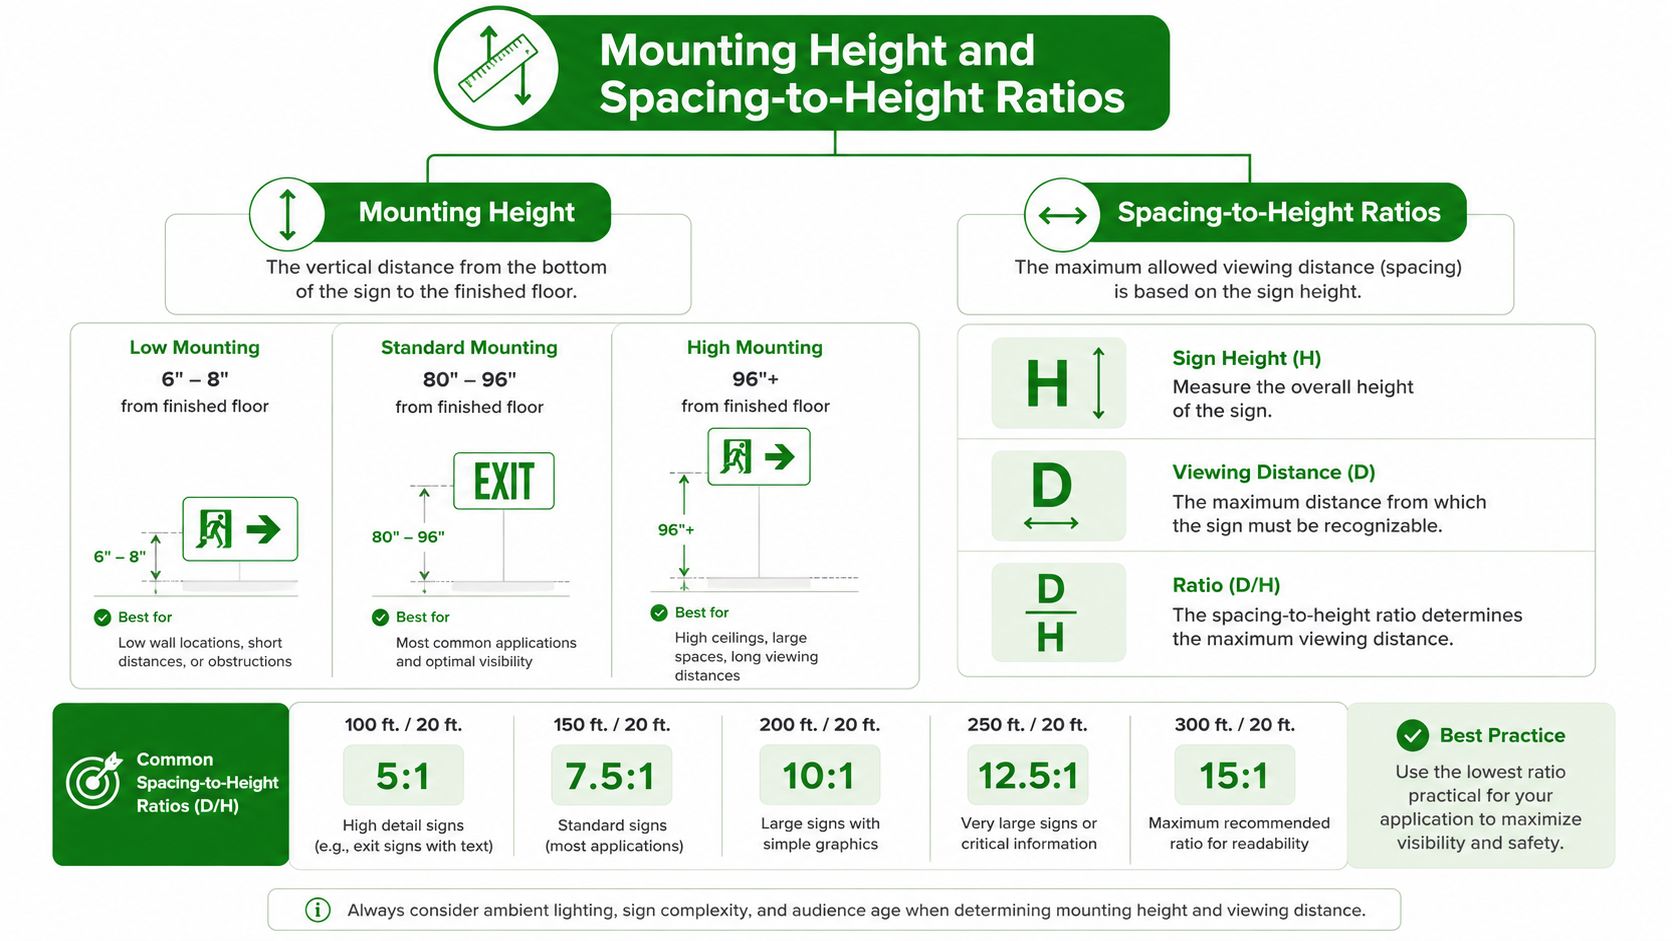
At the lower end of that range, fixtures sit closer together and usually deliver smoother coverage. Toward the upper end, the fixture optic and room conditions need more careful review. Push spacing too far and the floor can develop dark bands between luminaires even when the total lumen calculation appears adequate.
Start with the mounting height, then choose a conservative spacing ratio before you optimize fixture count. The uniformity section explains why this check often matters more than adding raw lumens.
The Lumen Method Formula and a Warehouse Worked Example
The standard calculation is:
Number of Fixtures = (Target Footcandles × Area) ÷ (Lumens per Fixture × CU × LLF)
The same relationship can be written in two stages:
- Required delivered lumens = target footcandles × area
- Usable lumens per fixture = fixture lumens × CU × LLF
- Fixture quantity = required delivered lumens ÷ usable lumens per fixture
Consider a 10,000-square-foot warehouse with 30-foot ceilings, a 30 fc target, 18,000 lumens per LED high bay, CU of 0.7, and LLF of 0.8. These are the stated assumptions for this example, not universal defaults.
Step one, calculate required lumens
Target illuminance multiplied by area gives:
30 fc × 10,000 sq ft = 300,000 lumens required at the work plane
Step two, calculate usable lumens per fixture
The selected fixture produces 18,000 raw lumens. Applying CU and LLF gives:
18,000 × 0.7 × 0.8 = 10,080 usable lumens per fixture
Step three, divide the requirements
300,000 ÷ 10,080 = 29.76 fixtures
The mathematical result is therefore 29.76 fixtures, which means the practical layout must use a whole-fixture quantity and then verify the grid. A quote should not stop at rounding. At 30 feet, the fixture position, optic, aisle arrangement, and spacing ratio can force a different final quantity.
For more practical fixture comparisons, pair the calculation with a warehouse LED high-bay lighting guide, then check the manufacturer's delivered lumens rather than relying on a nominal product label.
Solving for fixture lumens instead
If the electrical infrastructure or roof framing fixes the fixture count, reverse the formula:
Lumens per fixture = (Target Footcandles × Area) ÷ (Fixture Count × CU × LLF)
With the same room, if the layout can accommodate 32 fixtures:
Lumens per fixture = 300,000 ÷ (32 × 0.7 × 0.8)
That produces the lumen requirement for each fixture. The designer can then compare available products and confirm whether their optics support the intended spacing.
Worked Example for a Retail Back-of-House Space
A retail stockroom often needs a different answer from a warehouse storage bay because employees pick, read, sort, and move product in a tighter space. Take a 2,500-square-foot back-of-house room with 18-foot ceilings, a 50 fc target, and a fixture producing 18,000 lumens. For this example, retain a CU of 0.7 and LLF of 0.8 so the effect of the task target and room size stays easy to see.
First calculate the required delivered lumens:
50 fc × 2,500 sq ft = 125,000 lumens
Then calculate usable lumens per fixture:
18,000 × 0.7 × 0.8 = 10,080 usable lumens
The fixture count becomes:
125,000 ÷ 10,080 = 12.4 fixtures
The arithmetic points to a whole-fixture layout above twelve units. The final selection still depends on whether those fixtures can be arranged over active picking routes, shelving, and access paths without creating a dark central aisle or excessive brightness at the perimeter.
Output versus quantity
Suppose the electrical layout strongly favors fewer connection points. A higher-output luminaire may reduce the fixture count, but it can also create wider bright zones and more noticeable falloff between units. Conversely, more lower-output fixtures can improve visual continuity, simplify aisle alignment, and reduce the distance between light sources.
Neither approach wins automatically. At 18 feet, the installation may have more flexibility than a much taller warehouse, but the spacing criterion still needs to fit the selected optic. A fixture-count result that ignores the actual grid can look efficient on paper and perform poorly on the floor.
Use the formula to compare options, then draw the fixtures over the stockroom plan. If shelving changes later, revisit the arrangement rather than assuming the original average illuminance will remain representative.
Beyond Fixture Count, Uniformity and Spacing Criterion
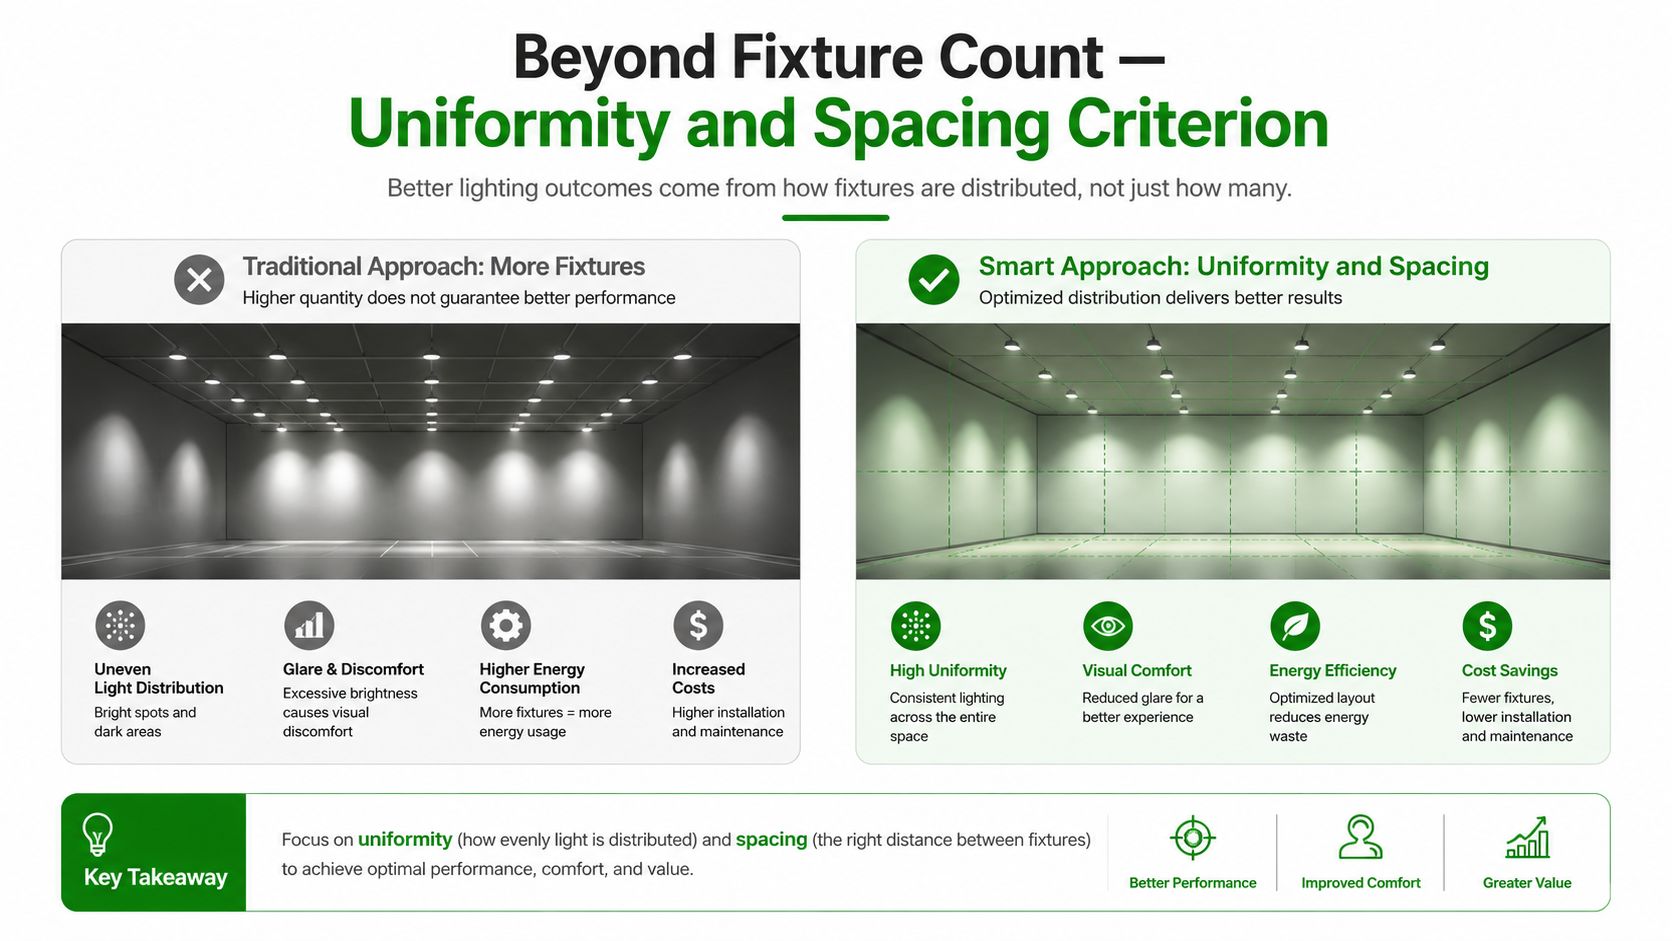
A fixture count tells you how many luminaires the equation needs. It doesn't tell you whether an employee can see consistently along an aisle, whether a forklift operator moves from bright zones into dark bands, or whether tall racks block useful light from reaching the floor.
That is why uniformity deserves its own check. Two layouts can use the same fixture count and total lumen output yet produce different results because the fixtures have different beam distributions, mounting positions, or photometric files. Rack geometry, aisle direction, wall offsets, obstructions, and cross-aisles all change the way light reaches the task plane.
What spacing criterion adds
The spacing criterion, or SC, comes from the fixture's photometric distribution. Manufacturers provide it with photometric data, commonly through an IES file. Lighting software uses that information to evaluate how far fixtures can be separated while maintaining the intended distribution.
A calculator without photometric data can't reproduce the full behavior of the selected luminaire. It may estimate average illuminance, but it won't reliably show how the beam interacts with a rack face, a dark ceiling, or an aisle that runs between fixture rows.
For a preliminary review, use three safeguards:
- Respect the S/MH starting range: Keep the grid within the approximate range discussed earlier unless the photometry supports a wider arrangement.
- Align with the work: In rack storage, place fixtures to serve aisles and cross-aisles rather than distributing light where no one performs a task.
- Look for vertical shadows: Tall racks can make floor light appear adequate while labels and product faces remain difficult to read.
More fixtures aren't a substitute for a coherent layout. Put light where the work happens, then verify the distribution.
The calculator output is therefore a screening tool. A defensible project file includes the assumptions, the proposed grid, the fixture photometry, and a review of uniformity rather than a quantity copied from an online form.
Adding Energy Savings and ROI to the Calculator
A fixture count becomes useful to the facility manager when it also shows connected load, annual energy use, and payback. Multiply the proposed fixture quantity by fixture wattage, then compare that result with the existing metal halide or high-pressure sodium system. Use the facility's actual operating hours and utility rate rather than a generic savings assumption.
A commercial comparison evaluates replacements for 250 to 450 W metal halide fixtures and lists 120 W LED replacements with a 57 to 73% energy reduction (commercial LED savings calculator data). Use that information as a reference range, not as a substitute for the project's measured fixture count, schedule, and tariff.
A defensible calculation sequence
Run the financial model from the same layout assumptions used for the lighting calculation:
- Existing annual energy: Existing fixture count × existing watts × annual operating hours.
- Proposed annual energy: Proposed fixture count × LED watts × annual operating hours.
- Annual energy difference: Existing energy minus proposed energy.
- Operating-cost difference: Annual energy difference × local electricity rate.
- Simple payback: Installed project cost ÷ annual operating-cost difference.
Keep controls, maintenance, rebates, emergency circuits, and financing separate unless their values are verified. A single savings percentage can hide assumptions about operating hours, lamp replacement, or control behavior, making the payback harder to defend.
The layout still sets the financial result. Adding fixtures may improve coverage and uniformity, but it also raises connected load and installed cost. A tighter, better-aimed arrangement can produce a stronger return than selecting fewer fixtures from the calculator.
For California facilities, compliance can affect fixture selection, controls, documentation, and commissioning. Review Title 24 lighting compliance services with the ROI model so the retrofit accounts for required project work, not only wattage reduction.
The owner should see both sides of the decision: the proposed arrangement must provide the required light and uniformity, while the financial model shows how fixture quantity, wattage, controls, and operating conditions affect cost.
Quick Reference Workflow You Can Reuse
A repeatable process keeps a quote from turning into a guess. Save this checklist with the floor plan and fixture cut sheets.
- Measure the bay: Record floor area, mounting height above the work plane, obstructions, walls, racks, and aisle direction.
- Set the task target: Choose the footcandle target by activity, not by building name alone.
- Select the luminaire: Confirm delivered lumens, wattage, optic, CRI, and operating conditions.
- Set CU and LLF: Use project-appropriate values from the manufacturer or lighting software. Document every assumption.
- Run the lumen method: Apply (target footcandles × area) ÷ (fixture lumens × CU × LLF), as demonstrated in the warehouse example.
- Validate the result: Check the S/MH relationship, aisle coverage, wall offsets, rack shadows, and photometric distribution.
- Price the operation: Extend the result into connected load, energy use, maintenance considerations, and payback.

The calculation gives you the quantity. The uniformity review tells you whether the arrangement works. The ROI review tells the owner what that arrangement means financially.
Common Calculator Mistakes and How to Avoid Them
Small input errors can make a result look precise while weakening the entire design.
- Wrong area units: Confirm whether the calculator expects square feet or square meters before entering the floor area. A unit mismatch can distort the result dramatically.
- LLF set to 1.0 without justification: A perfect retention assumption ignores expected degradation and dirt. Use a documented project value instead.
- Raw lumens used as delivered lumens: Check the fixture cut sheet. The formula needs the output associated with the selected luminaire, not a marketing value copied from a different configuration.
- CU chosen for the wrong room: A bright, open room and a dark, obstructed warehouse don't use the same utilization assumption. Match CU to room geometry, mounting height, and reflectance.
- Aisles treated as empty floor: Rack layouts change where light is needed. Overlay the proposed grid on the actual aisles and cross-aisles.
- Whole-fixture rounding ignored: A result such as 29.76 isn't an order quantity. Round into a practical layout, then validate spacing and performance.
Return to the warehouse example and change one input at a time. Increasing the target, lowering CU, or lowering LLF increases the calculated requirement. That simple sensitivity check helps you identify which assumptions are carrying the most weight before you approve a fixture schedule.
When to Move From a Calculator to a Full Lighting Design
An online calculator works well for early budgeting, fixture comparisons, and a preliminary conversation with an electrical contractor. It stops being sufficient when the project depends on verified uniformity, glare control, emergency operation, or formal compliance documentation.
Escalate to a photometric layout when the facility has tall racking, multiple mounting heights, mixed retail and storage functions, complicated obstructions, or task areas that cannot tolerate uneven light. A design-grade review uses the actual fixture's photometric file and places the luminaires on the actual floor plan.
Code-sensitive work deserves the same treatment. California projects may require Title 24 analysis, controls, testing, certification, and documentation. Occupancy changes, tenant improvements, emergency lighting, and permit requirements also move the work beyond calculator-grade planning.
A licensed contractor can coordinate the lighting layout with branch circuits, emergency systems, controls, access equipment, and installation conditions. That coordination matters in Southern California warehouses and commercial properties where the lighting plan must work with the building's electrical infrastructure, not just its ceiling dimensions.
The practical boundary is simple. Use the calculator to form a reasonable design question. Use photometric and electrical design services to produce an installable answer.
Frequently Asked Questions About High Bay Lighting Calculators
How does ceiling height change spacing rules?
As mounting height increases, optic selection and spacing become more important. Check the S/MH ratio, then confirm the manufacturer's photometric data. A higher ceiling does not automatically support wider fixture spacing. Verify uniformity on the actual layout.
How does LED wattage map to legacy metal halide?
Wattage is not a one-for-one replacement measure. Compare delivered lumens, optic, mounting height, existing light levels, and operating cost. As noted earlier, the commercial savings comparison covers 250 to 450 W metal halide systems, but the suitable LED replacement depends on the proposed layout and required illumination.
Can a calculator confirm emergency lighting levels?
No. A basic high bay calculator estimates normal lighting quantity and distribution. Emergency egress levels, battery operation, circuiting, testing, and code compliance require a dedicated emergency-lighting review.
Does California Title 24 change the calculator inputs?
It can affect controls, power allowances, documentation, and testing. The lumen formula remains useful for planning, but it does not replace the Title 24 compliance process or a permit-ready lighting design.
Access Electrical and Lighting provides commercial lighting design, high-bay installation, maintenance, emergency-lighting services, and Title 24 testing and documentation for Southern California facilities. For a warehouse or retail lighting quote, visit Access Electrical and Lighting to discuss fixture quantity, uniformity, compliance, and installation.