A property manager opens a lighting audit after a tenant complains about a dark stairwell. The parking lot report says the average reading is acceptable, yet drivers still notice bright patches beneath the poles and dim areas between them. Inside the office, desk-level glare is making screens difficult to use. The first instinct is often to enter room dimensions and fixture lumens into a foot candle calculator and accept the result.
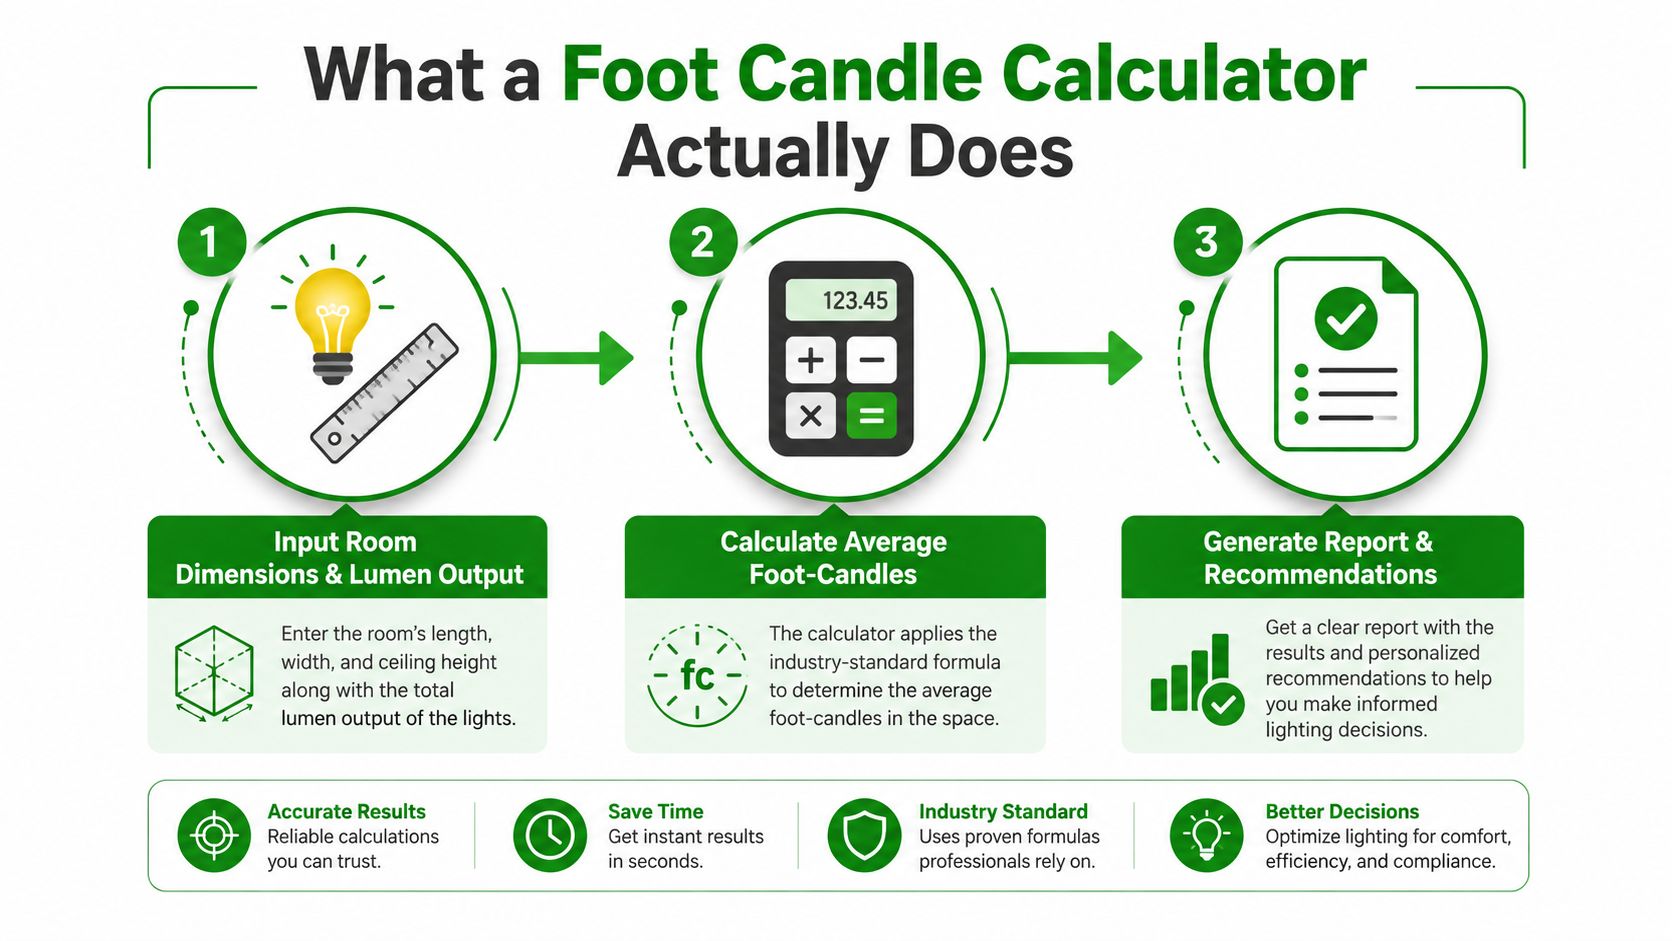
That approach misses the core job. A useful calculator workflow produces three outputs: the target illuminance for the visual task, the fixture quantity and layout needed to approach that target, and a defensible record showing how the design was checked in the field. Each output can fail if the person using the tool ignores the task plane, unit conversion, mounting conditions, or measurement method.
What a Foot Candle Calculator Actually Does
A foot candle calculator isn't just a box that returns a lighting number. It supports a sequence of decisions that starts before anyone enters lumens or square footage.
Start with the visual task
First, define what people must see and where they must see it. A corridor, open office, parking area, retail display, and stair tread don't have the same visual requirements. The relevant surface might be a desk, floor, stair nosing, merchandise shelf, or pavement. That surface is the visual plane, and the meter reading only means something if the measurement is taken there.
The most defensible workflow is to define the visual task and visual plane, select the applicable illuminance category or range from IES tables, and then convert the target into foot-candles when the project uses imperial units. This task-first method is described in the IES-based foot-candle methodology, which also emphasizes tolerance checking rather than relying on one exact result.
Move from target to layout
Once the target is clear, the calculator estimates how many fixtures can deliver the required average level across the area. It may use total lumens, fixture quantity, utilization assumptions, and area. That output helps with an early layout, retrofit comparison, or proposal.
It doesn't prove that every point will work. Fixture distribution, spacing, mounting height, surface reflectance, aiming, and obstructions still need review.
Practical rule: Treat the calculator's layout count as a design starting point, not as a field acceptance result.
Create a record someone else can follow
The third output is documentation. Record the selected target, units, fixture data, mounting height, area, assumptions, calculation method, and field readings. If an owner, inspector, or consultant can't reproduce the logic, the result is difficult to defend even when the space appears bright.
That discipline matters across the four situations most commercial teams face: parking lots with pole spacing issues, offices with desk-plane glare, corridors where uniformity matters, and stairwells where dark steps can create a safety concern.
Foot Candles and Lux Explained Without Jargon
A foot-candle measures illuminance, meaning the amount of light arriving at a surface. One foot-candle equals one lumen per square foot. Lux measures the same physical quantity using metric area, one lumen per square meter.
The difference is the size of the area used by the unit, not a different kind of light. A project can specify lux, foot-candles, or both, but the team must keep the unit visible from the initial target through the final inspection.
Use precision deliberately
The accepted conversion is one foot-candle equals 10.764 lux, as documented in this technical discussion of foot-candles, lux, and unit conversion practice. A calculator may display a factor such as 10.7639, 10.764, or 10.7639104167, as noted in this foot-candle-to-lux conversion reference.
Those factors describe the same conversion at different rounding levels. For a quick conversation with a building operator, rounding may be harmless. For a submittal, inspection record, consultant report, or portfolio that compares sites across countries, choose one factor and apply it consistently.
For a practical formula reference, use Access Electrical and Lighting's foot-candle-to-lux guide and keep the equation in the project worksheet:
- Lux = foot-candles × 10.764
- Foot-candles = lux ÷ 10.764
Keep the source unit visible
IES publications have shifted toward lux as the primary recommendation unit, while North American commercial work commonly continues to specify foot-candles. That creates a routine handoff problem. A lighting schedule may list lux, a contractor's proposal may use foot-candles, and a field meter may display either.
Write both values when the project crosses those conventions. Don't convert in one document, round the result in another, and leave the original target out of the record. Unit drift is one of the easiest ways to create an apparent compliance disagreement that began as a spreadsheet formatting choice.
The Formulas Behind Every Foot Candle Calculator
Most online tools and estimating spreadsheets use a version of the lumen method or the inverse square law. The first estimates average illuminance over an area. The second estimates illuminance at a particular point from a source at a given distance.
The lumen method for early sizing
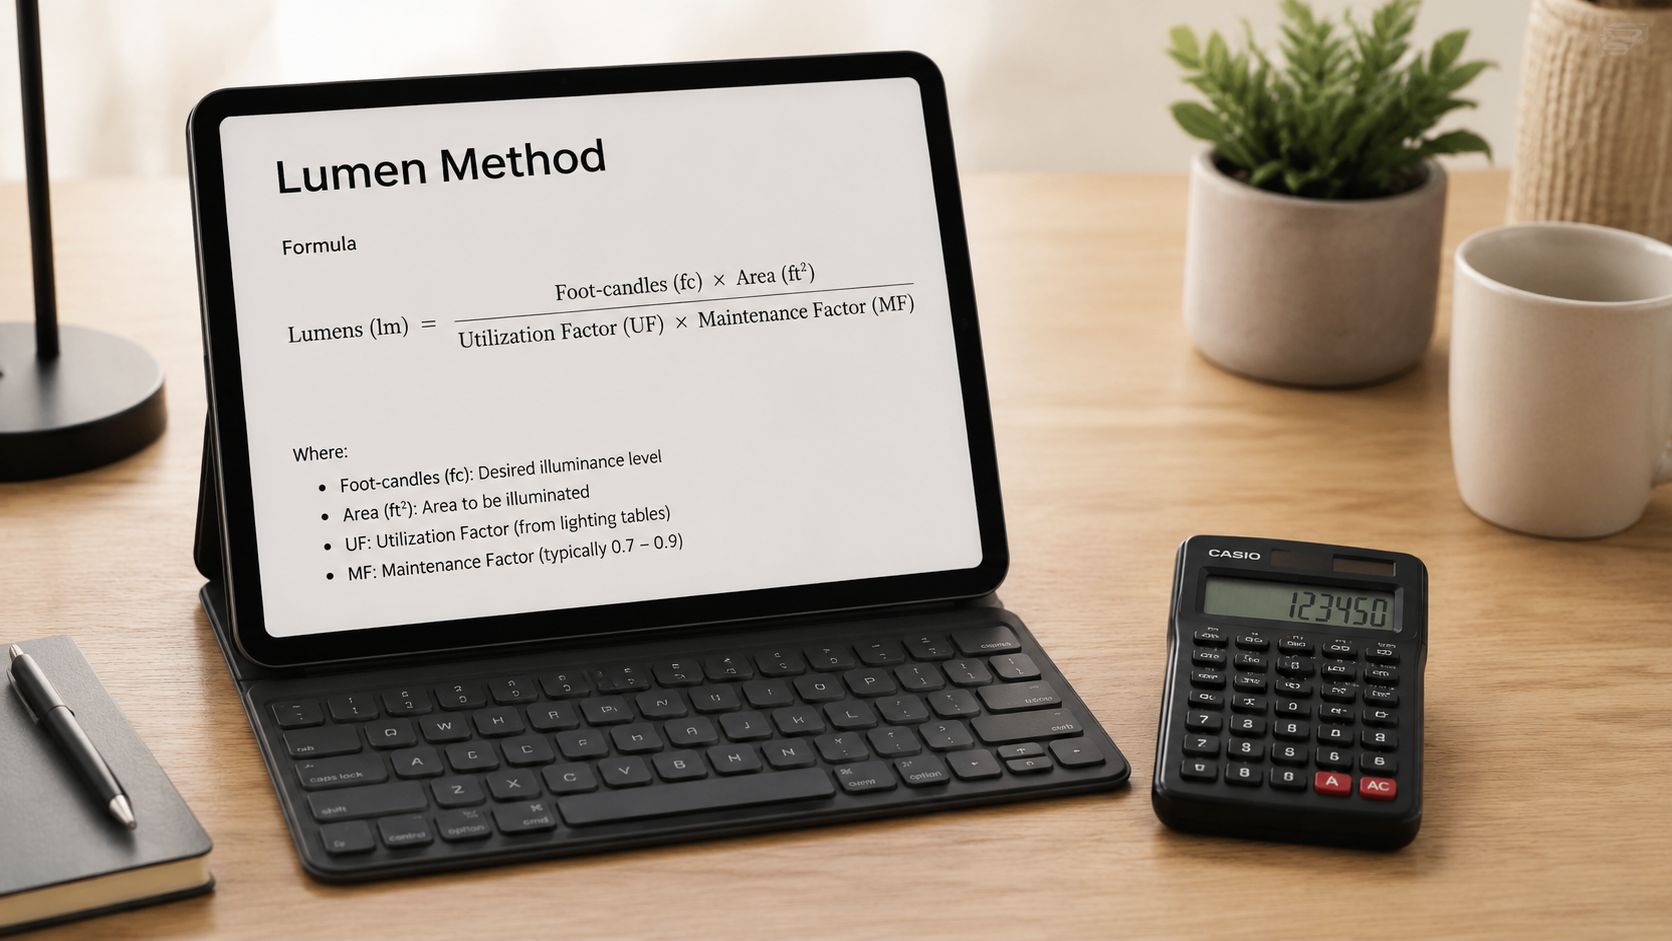
The basic relationship is:
Average foot-candles = total fixture lumens × utilization factor ÷ area
Suppose a room has four fixtures, each producing 4,000 lumens, and the estimated utilization factor is 0.60. If the room covers 1,000 square feet, the calculation is:
- Total fixture output: 4 × 4,000 = 16,000 lumens
- Usable estimated output: 16,000 × 0.60 = 9,600 lumens
- Average illuminance: 9,600 ÷ 1,000 = 9.6 foot-candles
That result is an average. It doesn't tell you whether the work surface beneath each fixture is comfortable, whether the perimeter is dim, or whether a dark ceiling absorbs more light than the estimate assumed.
The utilization factor is where room geometry, fixture distribution, and surface conditions enter the estimate. If the calculator doesn't ask about those items, it may be useful for a rough comparison but not for a final layout.
The inverse square law for point checks
For a point source, the relationship is:
Illuminance = luminous intensity ÷ distance squared
Assume a source has an intensity of 400 candela at the direction being evaluated, and the measurement point is 10 feet away. The estimate is:
400 ÷ 10² = 4 foot-candles
If the distance increases to 20 feet, the denominator becomes 400 rather than 100, so the estimated illuminance falls to 1 foot-candle. This is why a desk below a high-mounted source can feel dim even when the fixture has substantial lumen output.
The formula is valuable for sanity checks, pole-light geometry, and point-focused questions. It doesn't replace a photometric layout when several fixtures overlap or when the source isn't well approximated as a point.
Field observation: Averages hide the locations where people actually walk, work, read, or park.
Both formulas simplify reality. Reflective walls can add useful indirect light. A low fixture may produce a different distribution than a high fixture with the same lumen rating. Spacing, aiming, lens condition, obstructions, and mounting height can create dark pockets that the area formula never sees. Switch to a light meter and a point-by-point plan when the decision involves acceptance, safety, or a disputed tenant complaint.
Online Tools, Spreadsheets, or a Light Meter
The right tool depends on the decision. A browser calculator is fast, a spreadsheet preserves assumptions, and a light meter tells you what the installed system is doing.
| Tool | Best Use | Weakness | Documentation Value |
|---|---|---|---|
| Browser-based calculator | Early what-if comparisons and rough fixture sizing | Often skips mounting height, distribution, spacing, and reflectance | Low unless inputs and output are saved |
| Spreadsheet template | Retrofit bids, fixture schedules, and assumption tracking | Can carry forward bad assumptions or imply uniformity | High when formulas, inputs, and revisions are retained |
| On-site light meter | Existing-condition surveys and final verification | Measures selected points, not automatically the entire design | High when location, height, date, and conditions are recorded |
Browser tools work at the front end
Use an online foot candle calculator when you're comparing fixture options, testing room-area assumptions, or deciding whether a retrofit deserves a formal design. Enter the actual fixture lumen output, not a generic LED label, and note whether the value applies to the selected color temperature and CRI configuration.
A web widget becomes unreliable when it hides its utilization factor, assumes even spacing, or treats a parking lot like a rectangular interior room. It can answer, “What might this arrangement produce on average?” It can't answer, “Does the dark corner beside the stair door pass?”
Spreadsheets earn their place in proposals
A spreadsheet is the better middle step for a retrofit bid. Keep separate cells for area, fixture quantity, lumens per fixture, utilization assumption, target, units, mounting height, and final measured results. Lock the formula structure, but leave the assumptions visible so an owner can challenge them without reverse-engineering the file.
Add a revision column when the fixture count changes. That record distinguishes a preliminary estimate from the layout submitted for installation.
Meters provide the ground truth
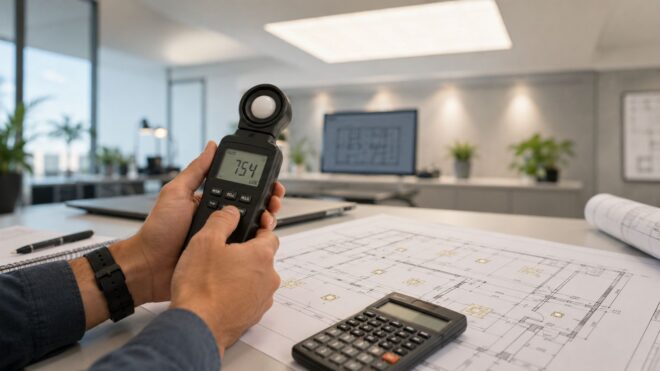
Use a light meter for existing-condition surveys, troubleshooting, and final verification. Measure at the task plane, not at a convenient standing height, and mark the grid or points so another technician can repeat the readings.
A meter reading is only as defensible as its context. Record the unit, measurement height, fixture operating state, daylight conditions where relevant, and the exact locations. A reading without location data is a number, not an audit trail.
Worked Examples for Parking Lots, Offices, Corridors, and Stairwells
Commercial spaces punish shortcuts in different ways. The same average calculation can support a reasonable early design in one area and hide a serious problem in another.
Parking lots need more than an average
For a parking lot, start with the project target and the pole layout. If the design uses 20 fixtures at 12,000 lumens each across 60,000 square feet, and the planning assumption is a utilization factor of 0.50, the lumen method gives:
20 × 12,000 × 0.50 ÷ 60,000 = 2 foot-candles average
That result can support an early comparison, but the proposal should also show pole locations, mounting heights, aiming, drive aisles, accessible routes, and perimeter conditions. The parking lot lighting standards guide is a useful project reference, but the installed grid still needs field verification.
Offices are measured at the work plane
An open office may use a general work-area target of 30 to 50 foot-candles, a range identified in the commercial foot-candle calculator guidance. Suppose 24 fixtures at 5,000 lumens each serve 12,000 square feet with a utilization assumption of 0.70:
24 × 5,000 × 0.70 ÷ 12,000 = 7 foot-candles average
That result is plainly below the stated office range, so the contractor must revisit fixture quantity, output, layout, or assumptions. Even when the average reaches the target, measure at desk height and check screen reflections, window contrast, and fixture spacing.
Corridors expose uniformity problems
A corridor can show an acceptable average while producing alternating bright and dim sections. Calculate the average from fixture output and corridor area, then inspect the points between fixtures, near corners, and beside wall returns. The calculator won't catch a poorly aimed wall-mounted luminaire or a dark section under a soffit.
Stairwells require point checks
In a stairwell, the relevant surfaces include treads, landings, and changes in direction. A ceiling-level average may not describe the illumination where a person places a foot. Check each critical area, including landings and the top and bottom of flights, then separately verify emergency lighting operation where that system is part of the project.
Proposal standard: Show the target, formula, fixture assumptions, layout drawing, and field verification method. Don't show only the final fixture count.
Why the Same Reading Can Mean Very Different Things
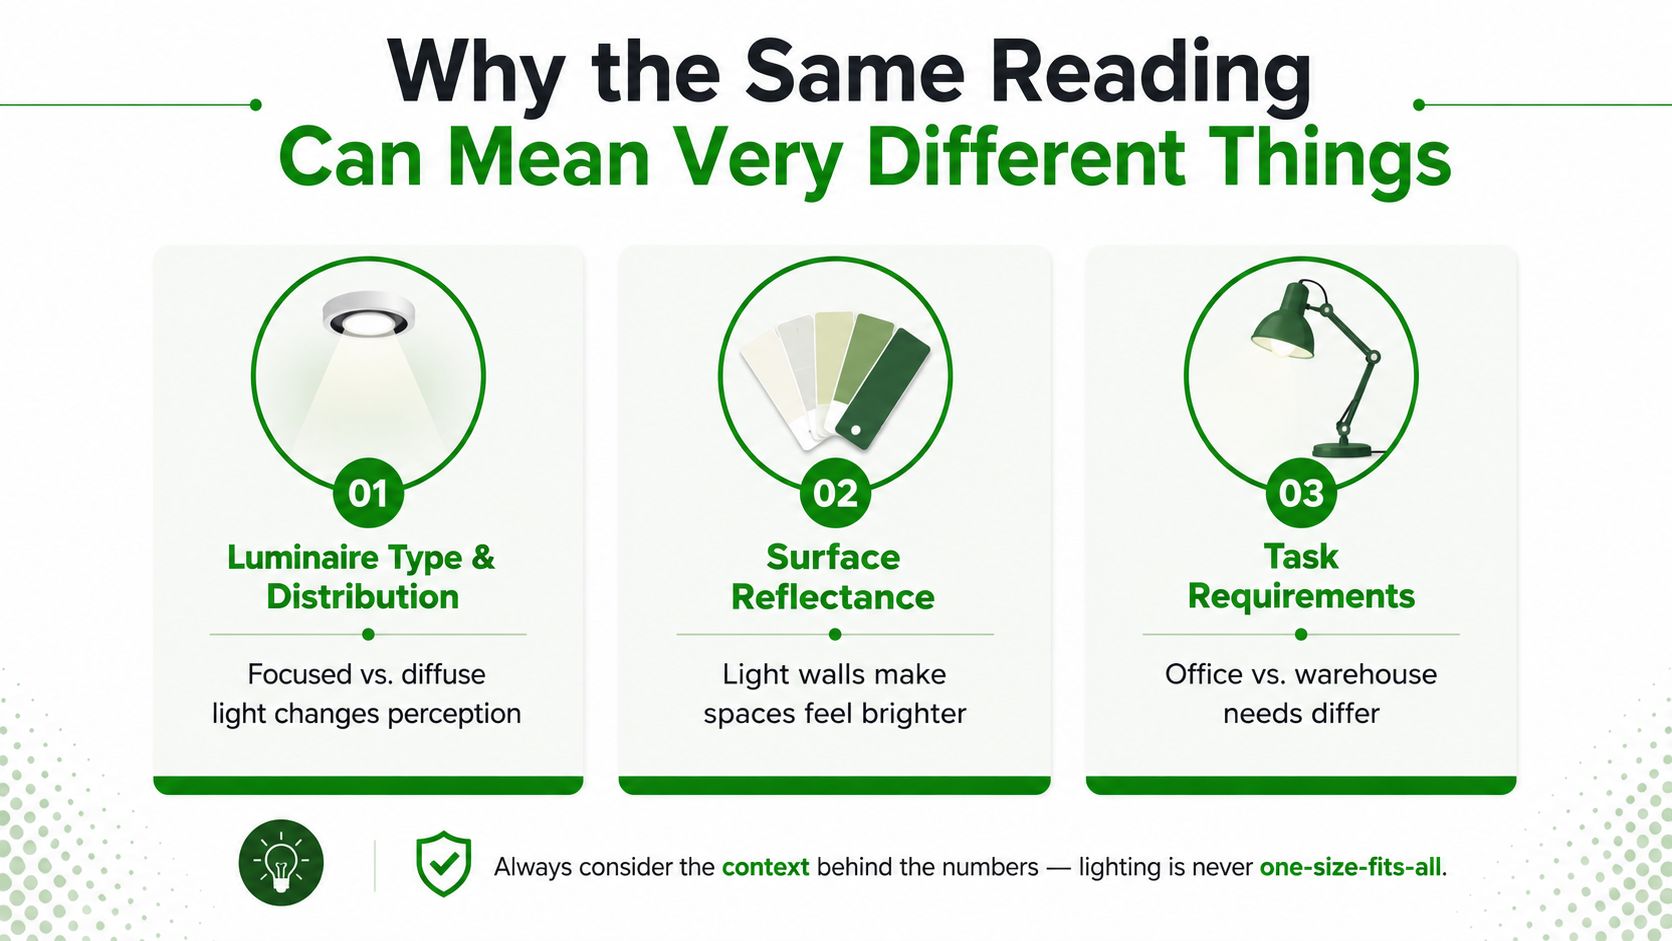
Two spaces can record the same average foot-candle level and still perform differently. A bright, evenly distributed office with light walls may feel comfortable, while a parking area with harsh glare and dark gaps may leave users struggling to see obstacles.
Measurement height changes the answer
A meter reading taken on the floor, at a desk, and at eye level describes different conditions. The task plane must match the activity. For walking surfaces, measure the floor or tread. For office work, measure the work surface. For a retail display, evaluate the merchandise plane and the surrounding circulation area.
Fixture distribution matters just as much. A narrow beam can create a strong reading directly below the luminaire and a weak reading a short distance away. A diffuse fixture may produce a lower peak but a more comfortable and useful pattern.
Reflectance affects visual experience
Illuminance measures light arriving at a surface. It doesn't directly measure how bright that surface appears to an observer. Wall color, flooring, ceiling finish, shelving, and furniture all influence reflected light and contrast.
Glare creates another failure mode. A fixture can deliver the planned light to a desk while reflecting directly into a screen or occupant's eyes. In parking areas, a fixture aimed toward a driver's approach can create discomfort even if pavement readings look acceptable.
Check the space, not only the average
Before sign-off, walk the space and compare the calculation with physical conditions:
- Task plane: Confirm that the meter height matches the surface people use.
- Spacing: Inspect the points midway between fixtures and poles.
- Obstructions: Check soffits, beams, trees, signs, shelving, and parked vehicles.
- Glare: View the luminaires from normal occupant and driver positions.
- Contrast: Look for dark doorways, stair edges, corners, and wall transitions.
- Operating state: Confirm controls, dimming, daylight response, and emergency modes.
The practical question isn't whether the calculator reached its target. It is whether the space meets the task, applicable code or project requirement, and visual-comfort expectation together.
Putting It to Work on LED Retrofits and Title 24
An LED retrofit proposal should connect three records: the existing condition, the proposed calculation, and the installed result. Start by surveying the current system, including fixture type, mounting height, operating condition, control state, and readings at relevant task points. Then model the proposed LED fixtures using the manufacturer's actual photometric information rather than a generic lumen package.
Build a transparent retrofit comparison
Keep the existing and proposed systems in separate columns. Show fixture quantity, rated input, total connected load, target illuminance, estimated average, distribution assumptions, and field readings. If the owner is evaluating energy performance, express the electrical comparison in watts per square foot, but don't let the energy metric replace the lighting result. A lower connected load isn't a successful retrofit if the stair treads or work surfaces remain inadequate.
The calculator should also reveal where the retrofit needs more investigation. A one-for-one replacement may preserve mounting locations but fail to address pole spacing, lens distribution, glare, or dark perimeter zones. A fixture-count reduction may look attractive in a bid and create a poor maintenance or safety outcome if the photometric pattern no longer overlaps properly.
Organize the Title 24 file
For California projects, keep the lighting calculation aligned with the applicable Title 24 lighting requirements and documentation guidance. The exact package depends on the project scope, but the record should make the design logic easy to trace.
Use a file structure that includes:
- Project basis: Identify the space, visual task, visual plane, and selected target.
- Fixture data: Record manufacturer, model, lumen output, distribution, controls, and mounting condition.
- Calculation method: State whether the worksheet uses an average lumen method, point calculations, or a formal photometric model.
- Unit record: Keep lux and foot-candles clearly labeled, with one conversion factor used consistently.
- Field verification: List measurement locations, heights, operating modes, and results.
- Exceptions: Explain areas affected by obstructions, daylight, emergency operation, or unusual finishes.

Avoid the errors that delay review
The recurring documentation problems are straightforward: mixed lux and foot-candle units, missing mounting height, undocumented fixture output, unexplained utilization assumptions, and inconsistent rounding between pages. Correct those before submission, not after an inspector asks how two reports describe the same room differently.
Access Electrical and Lighting provides commercial lighting work, LED retrofits, testing, and Title 24 certification and documentation for Southern California properties. Visit Access Electrical and Lighting to schedule a lighting survey, retrofit review, or compliance documentation consultation that connects calculator estimates with field-verified results.